IBM 2013 Annual Report Download - page 66
Download and view the complete annual report
Please find page 66 of the 2013 IBM annual report below. You can navigate through the pages in the report by either clicking on the pages listed below, or by using the keyword search tool below to find specific information within the annual report.-
 1
1 -
2
-
3
-
4
-
5
-
6
-
7
-
8
-
9
-
10
-
11
-
12
-
13
-
14
-
15
-
16
-
17
-
18
-
19
-
20
-
21
-
22
-
23
-
24
-
25
-
26
-
27
-
28
-
29
-
30
-
31
-
32
-
33
-
34
-
35
-
36
-
37
-
38
-
39
-
40
-
41
-
42
-
43
-
44
-
45
-
46
-
47
-
48
-
49
-
50
-
51
-
52
-
53
-
54
-
55
-
 56
56 -
 57
57 -
 58
58 -
 59
59 -
 60
60 -
 61
61 -
 62
62 -
 63
63 -
 64
64 -
 65
65 -
 66
66 -
 67
67 -
 68
68 -
 69
69 -
 70
70 -
 71
71 -
 72
72 -
 73
73 -
 74
74 -
 75
75 -
 76
76 -
77
-
78
-
79
-
80
-
81
-
82
-
83
-
84
-
85
-
86
-
87
-
88
-
89
-
90
-
91
-
92
-
93
-
94
-
95
-
96
-
97
-
98
-
99
-
100
-
101
-
102
-
103
-
104
-
105
-
106
-
107
-
108
-
109
-
110
-
111
-
112
-
113
-
114
-
115
-
116
-
117
-
118
-
119
-
120
-
121
-
122
-
123
-
124
-
125
-
126
-
127
-
128
-
129
-
130
-
131
-
132
-
133
-
134
-
135
-
136
-
137
-
138
-
139
-
140
-
141
-
142
-
143
-
144
-
145
-
146
-
147
-
148
-
149
-
150
-
151
-
152
-
153
-
154
 |
 |

65
Management Discussion
International Business Machines Corporation and Subsidiary Companies
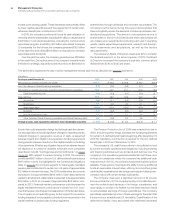
The company expects 2014 pre-tax retirement-related plan cost
to be approximately $2.1 billion, a decrease of approximately $800
million compared to 2013. This estimate reflects current pension
plan assumptions at December 31, 2013. Within total retirement-
related plan cost, operating retirement-related plan cost is expected
to be approximately $1.8 billion, flat versus 2013. Non-operating
retirement-related plan cost is expected to be approximately $300
million, a decrease of approximately $800 million compared to 2013,
driven by less recognized actuarial losses. Cash disbursements for
all retirement-related plans are expected to be approximately $2.9
billion in 2014, an increase of approximately $200 million compared
to 2013. See note S, “Retirement-Related Benefits,” on pages 127
to 141 for additional information.
The company’s effective tax rate for 2013 benefitted from the
recognition of discrete period tax events, including audit settle-
ments. The company expects, in the normal course of business,
that its effective tax rate and operating (non-GAAP) tax rate will
be approximately 23 percent in 2014. The rate will change year to
year based on nonrecurring events, such as the settlement of
income tax audits and changes in tax laws, as well as recurring
factors including the geographic mix of income before taxes, the
timing and amount of foreign dividend repatriation, state and local
taxes and the effects of various global income tax strategies.
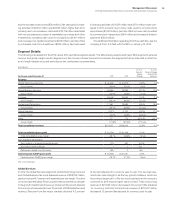
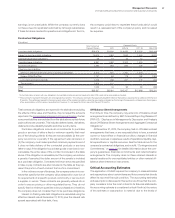
Liquidity and Capital Resources
The company has consistently generated strong cash flow from
operations, providing a source of funds ranging between $17.5 billion
and $20.8 billion per year over the past five years. The company
provides for additional liquidity through several sources: maintaining
an adequate cash balance, access to global funding sources, a
committed global credit facility and other committed and uncommit-
ted lines of credit worldwide. The following table provides a summary
of the major sources of liquidity for the years ended December 31,
2009 through 2013.
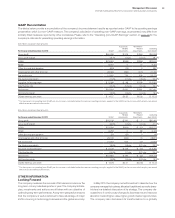
Cash Flow and Liquidity Trends
($ in billions)
2013 2012 2011 2010 2009
Net cash from
operating activities $17.5 $19.6 $19.8 $19.5 $20.8
Cash and short-term
marketable securities $11.1 $11.1 $11.9 $11.7 $14.0
Committed global
credit facility $10.0 $10.0 $10.0 $10.0 $10.0
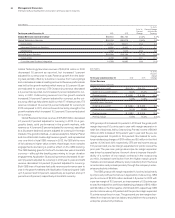
The major rating agencies’ ratings on the company’s debt securities
at December 31, 2013 appear in the following table and remain
unchanged from December 31, 2012. The company’s indenture
governing its debt securities and its various credit facilities each
contain significant covenants which obligate the company to
promptly pay principal and interest, limit the aggregate amount of
secured indebtedness and sale and leaseback transactions to 10
percent of the company’s consolidated net tangible assets, and
restrict the company’s ability to merge or consolidate unless certain
conditions are met. The credit facilities also include a covenant on
the company’s consolidated net interest expense ratio, which cannot
be less than 2.20 to 1.0, as well as a cross default provision with
respect to other defaulted indebtedness of at least $500 million.
The company is in compliance with all of its significant debt cov-
enants and provides periodic certification to its lenders. The failure
to comply with its debt covenants could constitute an event of
default with respect to the debt to which such provisions apply. If
certain events of default were to occur, the principal and interest on
the debt to which such event of default applied would become
immediately due and payable.
The company does not have “ratings trigger” provisions in its
debt covenants or documentation, which would allow the holders
to declare an event of default and seek to accelerate payments
thereunder in the event of a change in credit rating. The company’s
contractual agreements governing derivative instruments contain
standard market clauses which can trigger the termination of the
agreement if the company’s credit rating were to fall below investment
grade. At December 31, 2013, the fair value of those instruments that
were in a liability position was $501 million, before any applicable
netting, and this position is subject to fluctuations in fair value period
to period based on the level of the company’s outstanding instru-
ments and market conditions. The company has no other contractual
arrangements that, in the event of a change in credit rating, would
result in a material adverse effect on its financial position or liquidity.
Standard
& Poor’s
Moody’s
Investors
Service
Fitch
Ratings
Senior long-term debt AA- Aa3 A+
Commercial paper A-1+ Prime-1 F1
The company prepares its Consolidated Statement of Cash Flows
in accordance with applicable accounting standards for cash flow
presentation on page 81 and highlights causes and events underly-
ing sources and uses of cash in that format on page 45. For the
purpose of running its business, the company manages, monitors
and analyzes cash flows in a different format.
Management uses a free cash flow measure to evaluate the com-
pany’s operating results, plan share repurchase levels, evaluate strategic
investments and assess the company’s ability and need to incur and
service debt. Free cash flow is not a defined term under GAAP and it
should not be inferred that the entire free cash flow amount is available
for discretionary expenditures. The company defines free cash flow as
net cash from operating activities less the change in Global Financing
receivables and net capital expenditures, including the investment in
software. As discussed on page 33, a key objective of the Global Financ-
ing business is to generate strong returns on equity. Increasing
receivables is the basis for growth in a financing business. Accordingly,
management considers Global Financing receivables as a profit-gen-
erating investment, not as working capital that should be minimized for
efficiency. After considering Global Financing receivables as an invest-
ment, the remaining net operational cash flow less net capital
expenditures is viewed by the company as free cash flow.
From the perspective of how management views cash flow, in
2013, free cash flow was $15.0 billion, a decrease of $3.2 billion
compared to 2012. The decrease was driven by the company’s
operational performance, higher cash tax payments and changes