IBM 2013 Annual Report Download - page 28
Download and view the complete annual report
Please find page 28 of the 2013 IBM annual report below. You can navigate through the pages in the report by either clicking on the pages listed below, or by using the keyword search tool below to find specific information within the annual report.-
 1
1 -
2
-
3
-
4
-
5
-
6
-
7
-
8
-
9
-
10
-
11
-
12
-
13
-
14
-
15
-
16
-
17
-
 18
18 -
 19
19 -
 20
20 -
 21
21 -
 22
22 -
 23
23 -
 24
24 -
 25
25 -
 26
26 -
 27
27 -
 28
28 -
 29
29 -
 30
30 -
 31
31 -
 32
32 -
 33
33 -
 34
34 -
 35
35 -
 36
36 -
 37
37 -
 38
38 -
39
-
40
-
41
-
42
-
43
-
44
-
45
-
46
-
47
-
48
-
49
-
50
-
51
-
52
-
53
-
54
-
55
-
56
-
57
-
58
-
59
-
60
-
61
-
62
-
63
-
64
-
65
-
66
-
67
-
68
-
69
-
70
-
71
-
72
-
73
-
74
-
75
-
76
-
77
-
78
-
79
-
80
-
81
-
82
-
83
-
84
-
85
-
86
-
87
-
88
-
89
-
90
-
91
-
92
-
93
-
94
-
95
-
96
-
97
-
98
-
99
-
100
-
101
-
102
-
103
-
104
-
105
-
106
-
107
-
108
-
109
-
110
-
111
-
112
-
113
-
114
-
115
-
116
-
117
-
118
-
119
-
120
-
121
-
122
-
123
-
124
-
125
-
126
-
127
-
128
-
129
-
130
-
131
-
132
-
133
-
134
-
135
-
136
-
137
-
138
-
139
-
140
-
141
-
142
-
143
-
144
-
145
-
146
-
147
-
148
-
149
-
150
-
151
-
152
-
153
-
154
 |
 |

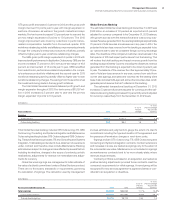
27
Management Discussion
International Business Machines Corporation and Subsidiary Companies
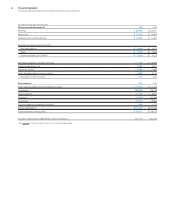
MANAGEMENT DISCUSSION SNAPSHOT
($ and shares in millions except per share amounts)
For the year ended December 31: 2013 2012
Yr.-to-Yr.
Percent/
Margin
Change
Revenue $ 99,751 $104,507 (4.6)%*
Gross profit margin 48.6% 48.1% 0.5 pts.
Total expense and other (income) $ 28,981 $ 28,396 2.1%
Total expense and other
(income)-to-revenue ratio 29.1% 27.2% 1.9 pts.
Income before income taxes $ 19,524 $ 21,902 (10.9)%
Provision for income taxes 3,041 5,298 (42.6)%
Net income $ 16,483 $ 16,604 (0.7)%
Net income margin 16.5% 15.9% 0.6 pts.
Earnings per share
of common stock
Assuming dilution $ 14.94 $ 14.37 4.0%
Weighted-average shares
outstanding
Assuming dilution 1,103.0 1,155.4 (4.5)%
Assets** $126,223 $119,213 5.9%
Liabilities** $103,294 $100,229 3.1%
Equity** $ 22,929 $ 18,984 20.8%
* (2.5) percent adjusted for currency.
** At December 31.
The following table provides the company’s operating (non-GAAP)
earnings for 2013 and 2012.
($ in millions except per share amounts)
For the year ended December 31: 2013 2012
Yr.-to-Yr.
Percent
Change
Net income as reported $16,483 $16,604 (0.7)%
Non-operating adjustments
(net of tax)
Acquisition-related charges 747 641 16.5
Non-operating retirement-related
costs/(income) 729 381 91.2
Operating (non-GAAP) earnings* $17,959 $17,627 1.9%
Diluted operating (non-GAAP)
earnings per share $ 16.28 $ 15.25 6.8%
*
See page 46 for a more detailed reconciliation of net income to operating (non-GAAP)
earnings.
In 2013, the company reported revenue of $99.8 billion, expanded
gross and net income margins, and delivered diluted earnings per
share growth of 4.0 percent as reported and 6.8 percent on an oper-
ating (non-GAAP) basis. The company generated $17.5 billion in cash
from operations and $15.0 billion in free cash flow driving shareholder
returns of $17.9 billion in gross common stock repurchases and divi-
dends. In 2013, the company continued the transformation of its
portfolio to higher value expending $3.1 billion to acquire 10 compa-
nies to expand its capabilities in its key growth areas, in addition to
maintaining high levels of investment of $6.2 billion in research and
development and $3.8 billion in net capital expenditures.
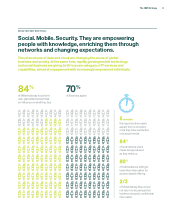
The company also continued to shift its investments to address
the key trends in information technology (IT)—social, mobile, big data/
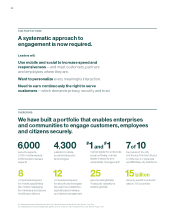
analytics and cloud. Several years ago, the company identified and
established objectives for four key growth initiatives—Smarter Planet,
business analytics, cloud and growth markets—to address these
trends. In 2013, across the business, Smarter Planet, business analyt-
ics and cloud had strong performance. Smarter Planet revenue grew
about 20 percent compared to 2012, with strength across all areas,
including Smarter Commerce, Smarter Cities, Social Business and
industry solutions. The company believes that data, as a natural
resource, will drive demand going forward, and that big data/analytics
will provide the basis for competitive differentiation. Business analyt-
ics revenue of $15.7 billion increased 9 percent year to year, led by
Global Business Services and Software. The company’s cloud solu-
tions address the full scope of client requirements including private
clouds, public clouds and hybrid clouds, as well as platform and
software-as-a-solution (SaaS)-based solutions. In 2013, the company
delivered $4.4 billion of cloud-based solutions revenue, an increase
of 69 percent compared to 2012. In addition, within that content, $1.7
billion was delivered as a service. Across the company’s performance,
there is overlap between these initiatives. In total, software makes up
about half of that combined content. The software content improves
the company’s business mix and contributes to margin expansion.
Segment revenue was led by Software which increased 1.9 per-
cent (3 percent adjusted for currency) driven by key branded
middleware which increased 4.8 percent (6 percent adjusted for cur-
rency). The key growth initiatives fueled this performance. Global
Business Services returned to revenue growth at constant currency
(down 0.9 percent as reported; up 3 percent adjusted for currency)
driven by the company’s investments in the Digital Front Office. While
revenue in Global Technology Services declined 4.2 percent (1 per-
cent adjusted for currency), revenue trajectory improved in the
second half and was stabilizing. Global Financing revenue improved
0.4 percent (3 percent adjusted for currency) versus 2012. The Soft-
ware, Global Services and Global Financing businesses all grew
pre-tax income and expanded their pre-tax margin in 2013 compared
to 2012. Systems and Technology impacted the company’s overall
performance in 2013. Revenue decreased 18.7 percent (18 percent
adjusted for currency) year to year driven by the back end of the
mainframe product cycle and business model challenges specific
to Power Systems, Storage and System x. Pre-tax income in Systems
and Technology decreased $1.7 billion compared to the prior year.
Revenue from the company’s growth markets underperformed
in 2013, particularly in the second half of the year. For the full year,
growth markets revenue decreased 4.9 percent as reported and
2 percent at constant currency. Overall, the company believes that
the opportunity in the growth markets remains attractive, and it is
intensifying its efforts on new growth opportunities in these markets.
The consolidated gross profit margin increased 0.5 points versus
2012 to 48.6 percent. This was the tenth consecutive year of improve-
ment in the gross profit margin. The operating (non-GAAP) gross margin
of 49.7 percent increased 0.9 points compared to the prior year. The
increase in gross margin in 2013 was driven by margin improvements
in the Global Services segments and an improved mix driven by Soft-
ware, partially offset by margin decreases in Systems and Technology.