IBM 2013 Annual Report Download - page 41
Download and view the complete annual report
Please find page 41 of the 2013 IBM annual report below. You can navigate through the pages in the report by either clicking on the pages listed below, or by using the keyword search tool below to find specific information within the annual report.-
 1
1 -
2
-
3
-
4
-
5
-
6
-
7
-
8
-
9
-
10
-
11
-
12
-
13
-
14
-
15
-
16
-
17
-
18
-
19
-
20
-
21
-
22
-
23
-
24
-
25
-
26
-
27
-
28
-
29
-
30
-
 31
31 -
 32
32 -
 33
33 -
 34
34 -
 35
35 -
 36
36 -
 37
37 -
 38
38 -
 39
39 -
 40
40 -
 41
41 -
 42
42 -
 43
43 -
 44
44 -
 45
45 -
 46
46 -
 47
47 -
 48
48 -
 49
49 -
 50
50 -
 51
51 -
52
-
53
-
54
-
55
-
56
-
57
-
58
-
59
-
60
-
61
-
62
-
63
-
64
-
65
-
66
-
67
-
68
-
69
-
70
-
71
-
72
-
73
-
74
-
75
-
76
-
77
-
78
-
79
-
80
-
81
-
82
-
83
-
84
-
85
-
86
-
87
-
88
-
89
-
90
-
91
-
92
-
93
-
94
-
95
-
96
-
97
-
98
-
99
-
100
-
101
-
102
-
103
-
104
-
105
-
106
-
107
-
108
-
109
-
110
-
111
-
112
-
113
-
114
-
115
-
116
-
117
-
118
-
119
-
120
-
121
-
122
-
123
-
124
-
125
-
126
-
127
-
128
-
129
-
130
-
131
-
132
-
133
-
134
-
135
-
136
-
137
-
138
-
139
-
140
-
141
-
142
-
143
-
144
-
145
-
146
-
147
-
148
-
149
-
150
-
151
-
152
-
153
-
154
 |
 |

40 Management Discussion
International Business Machines Corporation and Subsidiary Companies
Storwize products delivered double-digit growth, which were more
than offset by declines in legacy OEM mid-range offerings, and
declines in high-end offerings driven by significant pricing pressure.
Retail Store Solutions (RSS) revenue decreased 98.2 percent
(98 percent adjusted for currency) in 2013 versus 2012. In the third
quarter of 2012, the company divested the RSS business to Toshiba
TEC. See the caption, “Divestitures,” on page 98 for additional infor-
mation regarding the transaction.
Microelectronics OEM revenue decreased 11.9 percent (12 percent
adjusted for currency) in 2013 versus 2012.
($ in millions)
For the year ended December 31: 2013 2012
Yr.-to-Yr.
Percent/
Margin
Change
Systems and Technology
External gross profit $5,120 $6,903 (25.8)%
External gross profit margin 35.6% 39.1% (3.5) pts.
Pre-tax income $(507) $1,227 NM
Pre-tax margin (3.4)% 6.7% (10.1) pts.
NM—Not meaningful
The decrease in external gross profit in 2013 versus 2012 was due
to lower revenue and a lower overall gross profit margin reflecting
the business model challenges. Overall gross margin decreased 3.5
points in 2013 versus the prior year. The decrease was driven by
lower margins in Power Systems (1.0 points), System x (0.9 points),
Microelectronics (0.7 points) and Storage (0.4 points) as well as a
decline due to revenue mix (0.7 points), partially offset by margin
improvement in System z (0.1 points).
Systems and Technology’s pre-tax income decreased $1,734
million to a loss of $507 million in 2013, when compared to the prior
year. Pre-tax margin decreased 10.1 points in 2013 versus 2012. The
decline in pre-tax income was driven by the hardware businesses
which are dealing with business model challenges due to market
shifts and System z, as it entered the backend of the mainframe
product cycle late in the year.
Global Financing
See pages 72 through 75 for an analysis of Global Financing’s
segment results.
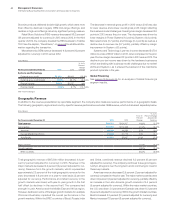
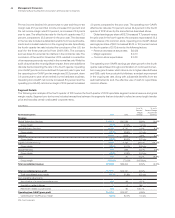
Geographic Revenue
In addition to the revenue presentation by reportable segment, the company also measures revenue performance on a geographic basis.
The following geographic, regional and country-specific revenue performance excludes OEM revenue, which is discussed separately below.
($ in millions)
For the year ended December 31: 2013 2012
Yr.-to-Yr.
Percent
Change
Yr.-to-Yr.
Percent Change
Adjusted for
Currency
Total revenue $99,751 $104,507 (4.6)%(2.5)%
Geographies $97,800 $102,268 (4.4)%(2.2)%
Americas 43,249 44,556 (2.9) (2.0)
Europe/Middle East/Africa 31,628 31,775 (0.5) (2.1)
Asia Pacific 22,923 25,937 (11.6) (2.8)
Major markets (4.2)%(2.2)%
Growth markets (4.9)%(2.4)%
BRIC countries (8.2)%(5.6)%
Total geographic revenue of $97,800 million decreased 4.4 per-
cent (2 percent adjusted for currency) in 2013. Revenue in the
major markets decreased 4.2 percent (2 percent adjusted for cur-
rency). Revenue from the growth markets, which represented
approximately 23 percent of the total geographic revenue for the
year, decreased 4.9 percent on a year-to-year basis (2 percent
adjusted for currency). Performance at constant currency in the
growth markets was mixed, with year-to-year growth in the first
half offset by declines in the second half. The company had
strength in Latin America and the Middle East and Africa region.
However, declines in some of the larger growth markets, for example
China and Australia, impacted the overall performance in the
growth markets. Within the BRIC countries of Brazil, Russia, India
and China, combined revenue declined 8.2 percent (6 percent
adjusted for currency). The company continues to see good oppor-
tunity in all regions over the long term and is continuing to invest in
these key markets.
Americas revenue decreased 2.9 percent (2 percent adjusted for
currency) compared to the prior year. The major market countries were
down 3.9 percent (4 percent adjusted for currency), partially offset by
an increase in the Latin America growth markets of 4.4 percent
(9 percent adjusted for currency). Within the major market countries,
the U.S. was down 3.4 percent and Canada was down 6.3 percent
(3 percent adjusted for currency). Within the growth market countries,
Brazil increased 3.3 percent (10 percent adjusted for currency) and
Mexico increased 7.8 percent (8 percent adjusted for currency).