IBM 2013 Annual Report Download - page 44
Download and view the complete annual report
Please find page 44 of the 2013 IBM annual report below. You can navigate through the pages in the report by either clicking on the pages listed below, or by using the keyword search tool below to find specific information within the annual report.-
 1
1 -
2
-
3
-
4
-
5
-
6
-
7
-
8
-
9
-
10
-
11
-
12
-
13
-
14
-
15
-
16
-
17
-
18
-
19
-
20
-
21
-
22
-
23
-
24
-
25
-
26
-
27
-
28
-
29
-
30
-
31
-
32
-
33
-
 34
34 -
 35
35 -
 36
36 -
 37
37 -
 38
38 -
 39
39 -
 40
40 -
 41
41 -
 42
42 -
 43
43 -
 44
44 -
 45
45 -
 46
46 -
 47
47 -
 48
48 -
 49
49 -
 50
50 -
 51
51 -
 52
52 -
 53
53 -
 54
54 -
55
-
56
-
57
-
58
-
59
-
60
-
61
-
62
-
63
-
64
-
65
-
66
-
67
-
68
-
69
-
70
-
71
-
72
-
73
-
74
-
75
-
76
-
77
-
78
-
79
-
80
-
81
-
82
-
83
-
84
-
85
-
86
-
87
-
88
-
89
-
90
-
91
-
92
-
93
-
94
-
95
-
96
-
97
-
98
-
99
-
100
-
101
-
102
-
103
-
104
-
105
-
106
-
107
-
108
-
109
-
110
-
111
-
112
-
113
-
114
-
115
-
116
-
117
-
118
-
119
-
120
-
121
-
122
-
123
-
124
-
125
-
126
-
127
-
128
-
129
-
130
-
131
-
132
-
133
-
134
-
135
-
136
-
137
-
138
-
139
-
140
-
141
-
142
-
143
-
144
-
145
-
146
-
147
-
148
-
149
-
150
-
151
-
152
-
153
-
154
 |
 |

43
Management Discussion
International Business Machines Corporation and Subsidiary Companies
The decrease in interest expense in 2013 versus 2012 was primarily
driven by lower average interest rates, partially offset by higher aver-
age debt levels. Interest expense is presented in cost of financing in
the Consolidated State ment of Earnings only if the related external
borrowings are to support the Global Financing external business.
See page 75 for additional information regarding Global Financing
debt and interest expense. Overall interest expense (excluding capi-
talized interest) for 2013 was $989 million, a decrease of $15 million
year to year.
Stock-Based Compensation
Total pre-tax stock-based compensation cost of $614 million
decreased $74 million compared to 2012. The decrease was primar-
ily related to performance share units ($48 million), the company’s
assumption of stock-based awards previously issued by acquired
entities ($16 million) and restricted stock units ($10 million). Stock-
based compensation cost, and the year-to-year change, was
reflected in the following categories: Cost: $122 million, down $10
million; SG&A expense: $435 million, down $63 million; and RD&E
expense: $57 million, down $2 million.
See note R, “Stock-Based Compensation,” on pages 124 to 127
for additional information on stock-based compensation.
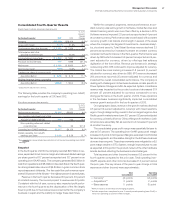
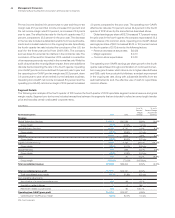
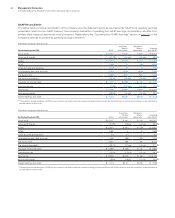
Retirement-Related Plans
The following table provides the total pre-tax cost for all retirement-
related plans. These amounts are included in the Consolidated
Statement of Earnings within the caption (e.g., Cost, SG&A, RD&E)
relating to the job function of the plan participants.
($ in millions)
For the year ended December 31: 2013 2012
Yr.-to-Yr.
Percent
Change
Retirement-related plans—cost
Service cost $ 545 $ 493 10.6%
Amortization of prior
service cost/(credits) (114)(148)(22.9)
Cost of defined contribution plans 1,384 1,506 (8.1)
Total operating costs $ 1,815 $ 1,851 (2.0)%
Interest cost 3,728 4,238 (12.0)
Expected return on plan assets (6,187)(6,356) (2.7)
Recognized actuarial losses 3,434 2,407 42.7
Plan amendments/curtailments/
settlements 01 (30.6)
Multi-employer plan/other costs 86 247 (65.4)
Total non-operating costs/(income) $ 1,062 $ 538 97.5%
Total retirement-related
plans—cost $ 2,876 $ 2,389 20.4%
In 2013, total retirement-related plan cost increased by $488 million
compared to 2012, primarily driven by an increase in recognized
actuarial losses ($1,027 million) and lower expected return on plan
assets ($169 million), partially offset by lower interest cost ($510 million)
and lower pension litigation cost ($152 million).
As discussed in the “Operating (non-GAAP) Earnings” section
on page 26, the company characterizes certain retirement-related
costs as operating and others as non-operating. Utilizing this
characterization, operating retirement-related costs in 2013 were
$1,815 million, a decrease of $36 million compared to 2012, driven
by lower cost of defined contribution plans ($122 million), partially
offset by increased service cost ($52 million) and increased amor-
tization of prior service cost ($34 million). Non-operating costs of
$1,062 million increased $524 million in 2013, compared to the
prior year, driven primarily by the increase in recognized actuarial
losses ($1,027 million) and lower expected return on plan assets
($169 million), partially offset by lower interest cost ($510 million)
and lower pension litigation cost ($152 million).
Income Taxes
The effective tax rate for 2013 was 15.6 percent, a decrease of 8.6
points versus the prior year, driven by the following factors:
• A benefit resulting from the completion of the U.S. 2008-2010
tax audit, including the associated reserve redeterminations
(11.5 points);
• A benefit due to a more favorable geographic mix of pre-tax
income in 2013 (2.4 points);
• Benefits from the retroactive impact of the 2012 American
Taxpayer Relief Act (0.7 points) and an increase in research
and development credits (0.6 points);
• A benefit from a tax agreement which required a reassess-
ment of certain valuation allowances on deferred tax assets
(1.5 points); and
• Benefits from the resolution of certain non-U.S. tax audits
(0.8 points) and newly enacted U.S. state tax legislation
(0.6 points); partially offset by
• Tax charges related to certain intercompany payments
made by foreign subsidiaries and the intercompany licensing
of certain IP (9.1 points); and
• The year-over-year impact of the 2012 benefit related to a tax
restructuring in Latin America (0.8 points).
The operating (non-GAAP) effective tax rate was 16.0 percent, a
decrease of 8.0 points versus 2012 principally driven by the same
factors described above.
Earnings Per Share
Basic earnings per share is computed on the basis of the weighted-
average number of shares of common stock outstanding during
the period. Diluted earnings per share is computed on the basis
of the weighted-average number of shares of common stock out-
standing plus the effect of dilutive potential common shares
outstanding during the period using the treasury stock method.
Dilutive potential common shares include outstanding stock options
and stock awards.