IBM 2013 Annual Report Download - page 56
Download and view the complete annual report
Please find page 56 of the 2013 IBM annual report below. You can navigate through the pages in the report by either clicking on the pages listed below, or by using the keyword search tool below to find specific information within the annual report.-
 1
1 -
2
-
3
-
4
-
5
-
6
-
7
-
8
-
9
-
10
-
11
-
12
-
13
-
14
-
15
-
16
-
17
-
18
-
19
-
20
-
21
-
22
-
23
-
24
-
25
-
26
-
27
-
28
-
29
-
30
-
31
-
32
-
33
-
34
-
35
-
36
-
37
-
38
-
39
-
40
-
41
-
42
-
43
-
44
-
45
-
 46
46 -
 47
47 -
 48
48 -
 49
49 -
 50
50 -
 51
51 -
 52
52 -
 53
53 -
 54
54 -
 55
55 -
 56
56 -
 57
57 -
 58
58 -
 59
59 -
 60
60 -
 61
61 -
 62
62 -
 63
63 -
 64
64 -
 65
65 -
 66
66 -
67
-
68
-
69
-
70
-
71
-
72
-
73
-
74
-
75
-
76
-
77
-
78
-
79
-
80
-
81
-
82
-
83
-
84
-
85
-
86
-
87
-
88
-
89
-
90
-
91
-
92
-
93
-
94
-
95
-
96
-
97
-
98
-
99
-
100
-
101
-
102
-
103
-
104
-
105
-
106
-
107
-
108
-
109
-
110
-
111
-
112
-
113
-
114
-
115
-
116
-
117
-
118
-
119
-
120
-
121
-
122
-
123
-
124
-
125
-
126
-
127
-
128
-
129
-
130
-
131
-
132
-
133
-
134
-
135
-
136
-
137
-
138
-
139
-
140
-
141
-
142
-
143
-
144
-
145
-
146
-
147
-
148
-
149
-
150
-
151
-
152
-
153
-
154
 |
 |

55
Management Discussion
International Business Machines Corporation and Subsidiary Companies
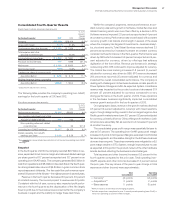
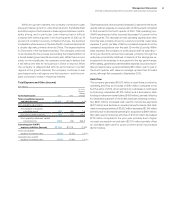
and the increase in net income ($749 million). Net cash used in invest-
ing activities of $9,004 million was $4,608 million higher than 2011,
primarily due to an increase in cash used of $2,719 million associated
with net purchases and sales of marketable securities and other
investments, increased cash used for acquisitions ($1,911 million)
and increased net capital investments ($248 million), partially offset
by increased cash from divestitures ($585 million). Net cash used
in financing activities of $11,976 million was $1,719 million lower com-
pared to 2011, primarily due to lower cash used for common stock
repurchases ($3,051 million), partially offset by lower cash provided
by common stock transactions ($914 million) and increased dividend
payments ($300 million).
For additional information regarding 2002 free cash flow, see the
company’s Form 8-K filed with the SEC on January 22, 2013.
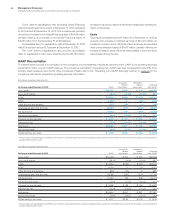
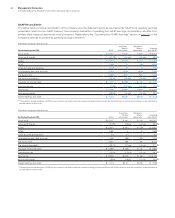
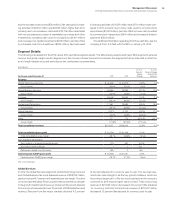
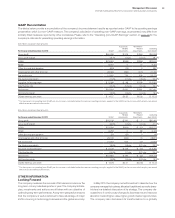
Segment Details
The following is an analysis of the 2012 versus 2011 reportable segment results. The table below presents each reportable segment’s external
revenue and gross margin results. Segment pre-tax income includes transactions between the segments that are intended to reflect an
arm’s-length transfer price and excludes certain unallocated corporate items.
($ in millions)
For the year ended December 31: 2012 2011
Yr.-to-Yr.
Percent/
Margin
Change
Yr.-to-Yr.
Percent Change
Adjusted for
Currency
Revenue
Global Technology Services $ 40,236 $ 40,879 (1.6)% 1.3%
Gross margin 36.6% 35.0% 1.6 pts.
Global Business Services 18,566 19,284 (3.7)% (1.6)%
Gross margin 30.0% 28.8% 1.2 pts.
Software 25,448 24,944 2.0%4.3%
Gross margin 88.7% 88.5% 0.2 pts.
Systems and Technology 17,667 18,985 (6.9)% (5.9)%
Gross margin 39.1% 39.8% (0.7) pts.
Global Financing 2,013 2,102 (4.2)% (1.2)%
Gross margin 46.5% 49.8% (3.3 ) pts.
Other 577 722 (20.1)% (18.7)%
Gross margin (71.6)% (54.5)% (17.1) pts.
Total consolidated revenue $104,507 $106,916 (2.3)% 0.0%
Total consolidated gross profit $ 50,298 $ 50,138 0.3%
Total consolidated gross margin 48.1% 46.9% 1.2 pts.
Non-operating adjustments
Amortization of acquired intangible assets 375 340 10.3%
Acquisition-related charges 1 1 13.1
Retirement-related costs/(income) 264 2 NM
Operating (non-GAAP) gross profit $ 50,938 $ 50,481 0.9%
Operating (non-GAAP) gross margin 48.7% 47.2% 1.5 pts.
NM—Not meaningful
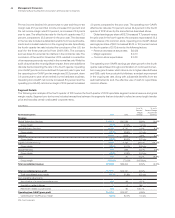
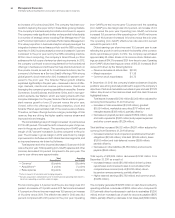
Global Services
In 2012, the Global Services segments, Global Technology Services
and Global Business Services, delivered revenue of $58,802 million,
grew pre-tax profit 7 percent and expanded pre-tax margin 1.5 points
on an as-reported basis. Revenue performance was led by strength
in the growth markets which were up 4.8 percent (9 percent adjusted
for currency) and represented over 20 percent of total Global Services
revenue. Revenue from the major markets declined 4.0 percent
(2 percent adjusted for currency) year to year. The services seg-
ments also had strength in all the key growth initiatives, which are
becoming a larger part of the services business as the company
continues to shift toward higher value content. Total outsourcing
revenue of $27,552 million decreased 2.6 percent (flat adjusted
for currency) and total transactional revenue of $23,907 million
decreased 1.8 percent (flat adjusted for currency) year to year.