IBM 2013 Annual Report Download - page 81
Download and view the complete annual report
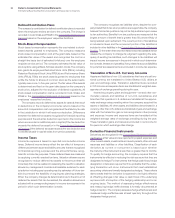
Please find page 81 of the 2013 IBM annual report below. You can navigate through the pages in the report by either clicking on the pages listed below, or by using the keyword search tool below to find specific information within the annual report.-
 1
1 -
2
-
3
-
4
-
5
-
6
-
7
-
8
-
9
-
10
-
11
-
12
-
13
-
14
-
15
-
16
-
17
-
18
-
19
-
20
-
21
-
22
-
23
-
24
-
25
-
26
-
27
-
28
-
29
-
30
-
31
-
32
-
33
-
34
-
35
-
36
-
37
-
38
-
39
-
40
-
41
-
42
-
43
-
44
-
45
-
46
-
47
-
48
-
49
-
50
-
51
-
52
-
53
-
54
-
55
-
56
-
57
-
58
-
59
-
60
-
61
-
62
-
63
-
64
-
65
-
66
-
67
-
68
-
69
-
70
-
 71
71 -
 72
72 -
 73
73 -
 74
74 -
 75
75 -
 76
76 -
 77
77 -
 78
78 -
 79
79 -
 80
80 -
 81
81 -
 82
82 -
 83
83 -
 84
84 -
 85
85 -
 86
86 -
 87
87 -
 88
88 -
 89
89 -
 90
90 -
 91
91 -
92
-
93
-
94
-
95
-
96
-
97
-
98
-
99
-
100
-
101
-
102
-
103
-
104
-
105
-
106
-
107
-
108
-
109
-
110
-
111
-
112
-
113
-
114
-
115
-
116
-
117
-
118
-
119
-
120
-
121
-
122
-
123
-
124
-
125
-
126
-
127
-
128
-
129
-
130
-
131
-
132
-
133
-
134
-
135
-
136
-
137
-
138
-
139
-
140
-
141
-
142
-
143
-
144
-
145
-
146
-
147
-
148
-
149
-
150
-
151
-
152
-
153
-
154
 |
 |

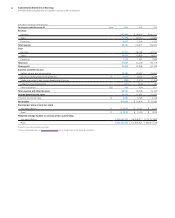
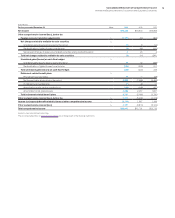
80 Consolidated Statement of Financial Position
International Business Machines Corporation and Subsidiary Companies
($ in millions except per share amounts)
At December 31: Notes 2013 2012
Assets
Current assets
Cash and cash equivalents $ 10,716 $ 10,412
Marketable securities D350 717
Notes and accounts receivable—trade (net of allowances of $291 in 2013 and $255 in 2012) 10,465 10,667
Short-term financing receivables (net of allowances of $308 in 2013 and $288 in 2012) F19,787 18,038
Other accounts receivable (net of allowances of $36 in 2013 and $17 in 2012) 1,584 1,873
Inventories E2,310 2,287
Deferred taxes N1,651 1,415
Prepaid expenses and other current assets 4,488 4,024
Total current assets 51,350 49,433
Property, plant and equipment G40,475 40,501
Less: Accumulated depreciation G26,654 26,505
Property, plant and equipment—net G13,821 13,996
Long-term financing receivables (net of allowances of $80 in 2013 and $66 in 2012) F12,755 12,812
Prepaid pension assets S5,551 945
Deferred taxes N3,051 3,973
Goodwill I31,184 29,247
Intangible assets—net I3,871 3,787
Investments and sundry assets H4,639 5,021
Total assets $ 126,223 $ 119,213
Liabilities and equity
Current liabilities
Ta xes N$ 4,633 $ 4,948
Short-term debt D&J 6,862 9,181
Accounts payable 7,461 7,952
Compensation and benefits 3,893 4,745
Deferred income 12,557 11,952
Other accrued expenses and liabilities 4,748 4,847
Total current liabilities 40,154 43,625
Long-term debt D&J 32,856 24,088
Retirement and nonpension postretirement benefit obligations S 16,242 20,418
Deferred income 4,108 4,491
Other liabilities K 9,934 7,607
Total liabilities 103,294 100,229
Contingencies and commitments M
Equity L
IBM stockholders’ equity
Common stock, par value $.20 per share, and additional paid-in capital 51,594 50,110
Shares authorized: 4,687,500,000
Shares issued (2013—2,207,522,548; 2012—2,197,561,159)
Retained earnings 130,042 117,641
Treasury stock, at cost (shares: 2013—1,153,131,611; 2012—1,080,193,483) (137,242)(123,131)
Accumulated other comprehensive income/(loss) (21,602)(25,759)
Total IBM stockholders’ equity 22,792 18,860
Noncontrolling interests A 137 124
Total equity 22,929 18,984
Total liabilities and equity $ 126,223 $ 119,213
Amounts may not add due to rounding.
The accompanying notes on pages 84 through 146 are an integral part of the financial statements.