IBM 2013 Annual Report Download - page 60
Download and view the complete annual report
Please find page 60 of the 2013 IBM annual report below. You can navigate through the pages in the report by either clicking on the pages listed below, or by using the keyword search tool below to find specific information within the annual report.-
 1
1 -
2
-
3
-
4
-
5
-
6
-
7
-
8
-
9
-
10
-
11
-
12
-
13
-
14
-
15
-
16
-
17
-
18
-
19
-
20
-
21
-
22
-
23
-
24
-
25
-
26
-
27
-
28
-
29
-
30
-
31
-
32
-
33
-
34
-
35
-
36
-
37
-
38
-
39
-
40
-
41
-
42
-
43
-
44
-
45
-
46
-
47
-
48
-
49
-
 50
50 -
 51
51 -
 52
52 -
 53
53 -
 54
54 -
 55
55 -
 56
56 -
 57
57 -
 58
58 -
 59
59 -
 60
60 -
 61
61 -
 62
62 -
 63
63 -
 64
64 -
 65
65 -
 66
66 -
 67
67 -
 68
68 -
 69
69 -
 70
70 -
71
-
72
-
73
-
74
-
75
-
76
-
77
-
78
-
79
-
80
-
81
-
82
-
83
-
84
-
85
-
86
-
87
-
88
-
89
-
90
-
91
-
92
-
93
-
94
-
95
-
96
-
97
-
98
-
99
-
100
-
101
-
102
-
103
-
104
-
105
-
106
-
107
-
108
-
109
-
110
-
111
-
112
-
113
-
114
-
115
-
116
-
117
-
118
-
119
-
120
-
121
-
122
-
123
-
124
-
125
-
126
-
127
-
128
-
129
-
130
-
131
-
132
-
133
-
134
-
135
-
136
-
137
-
138
-
139
-
140
-
141
-
142
-
143
-
144
-
145
-
146
-
147
-
148
-
149
-
150
-
151
-
152
-
153
-
154
 |
 |

59
Management Discussion
International Business Machines Corporation and Subsidiary Companies
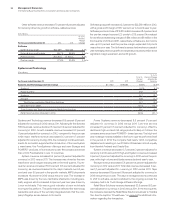
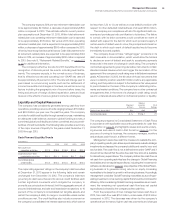
Microelectronics OEM revenue decreased 14.4 percent
(14 percent adjusted for currency) in 2012 versus 2011.
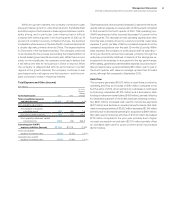
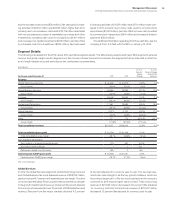
($ in millions)
For the year ended December 31: 2012 2011
Yr.-to-Yr.
Percent/
Margin
Change
Systems and Technology
External gross profit $6,903 $7,555 (8.6)%
External gross profit margin 39.1% 39.8% (0.7) pts.
Pre-tax income $1,227 $1,633 (24.9)%
Pre-tax margin 6.7%8.2%(1.5) pts.
The decrease in external gross profit in 2012 versus 2011 was due
to lower revenue and a lower overall gross profit margin.
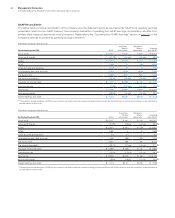
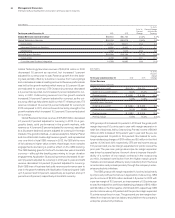
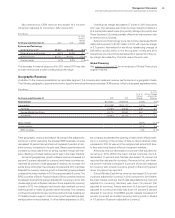
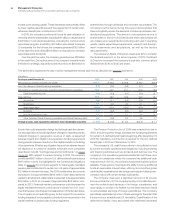
Geographic Revenue
In addition to the revenue presentation by reportable segment, the company also measures revenue performance on a geographic basis.
The following geographic, regional and country-specific revenue performance excludes OEM revenue, which is discussed separately below.
($ in millions)
For the year ended December 31: 2012 2011
Yr.-to-Yr.
Percent
Change
Yr.-to-Yr.
Percent Change
Adjusted for
Currency
Total revenue $104,507 $106,916 (2.3)% 0.0%
Geographies $102,268 $104,170 (1.8)% 0.5%
Americas 44,556 44,944 (0.9) 0.0
Europe/Middle East/Africa 31,775 33,952 (6.4) (1.0)
Asia Pacific 25,937 25,273 2.6 3.3
Major markets (3.5)% (1.3)%
Growth markets 4.2% 6.9%
BRIC countries 7.4% 12.2%
Overall gross margin decreased 0.7 points in 2012 versus the
prior year. The decrease was driven by lower margins in System x
(0.6 points), Microelectronics (0.6 points), Storage (0.5 points) and
Power Systems (0.2 points), partially offset by an improvement due
to revenue mix (1.2 points).
Systems and Technology’s pre-tax income decreased $406
million (24.9 percent) to $1,227 million in 2012, with a pre-tax margin
of 6.7 percent. Normalized for workforce rebalancing charges of
$46 million and $3 million in the third quarter of 2012 and 2011,
respectively, pre-tax income decreased 22.2 percent and the pre-
tax margin decreased by 1.3 points versus the prior year.
Global Financing
See pages 72 through 75 for an analysis of Global Financing’s
segment results.
Total geographic revenue decreased 1.8 percent (flat adjusted for
currency) in 2012; excluding the divested RSS business, revenue
decreased 1.4 percent as reported, but increased 1 percent at con-
stant currency compared to the prior year. Revenue performance at
constant currency was driven by strong results in the growth mar-
kets, offsetting a modest decline year to year in the major markets.
Across all geographies, growth markets revenue increased 4.2
percent (7 percent adjusted for currency) and these countries rep-
resented 24 percent of total geographic revenue, an increase of 8
points since 2006 when the company introduced its 2010 road map.
Adjusted for currency, revenue growth in these fast growing markets
outpaced the major markets in 2012 by approximately 8 points. The
BRIC countries of Brazil, Russia, India and China combined revenue
increased 7.4 percent (12 percent adjusted for currency) in 2012, with
double-digit growth in Russia, India and China, adjusted for currency.
Overall in 2012, the company had double-digit constant currency
revenue growth in nearly 35 growth market countries. The company
continued to expand into new countries and territories, building out
IT infrastructures in support of economic growth and taking a lead-
ership position in key industries. To drive market expansion, in 2012,
the company accelerated the opening of new branch offices result-
ing in a doubling of the number of face-to-face branches when
compared to 2011. At year end, the company had almost 450 face-
to-face and virtual branch offices in the growth markets.
Americas revenue decreased 0.9 percent (flat adjusted for
currency) in 2012. Within the major market countries, the U.S.
decreased 1.1 percent and Canada decreased 1.5 percent as
reported (flat adjusted for currency). Revenue in the Latin Amer-
ica growth markets increased 1.4 percent (8 percent adjusted
for currency) with constant currency growth in Brazil of 6 percent,
down 4.6 percent as reported.
Europe/Middle East/Africa revenue decreased 6.4 percent
(1 percent adjusted for currency) in 2012 compared to 2011. Within
the major market countries, the UK was essentially flat (up 1 percent
adjusted for currency), Germany was down 7.6 percent (flat
adjusted for currency), France was down 12.6 percent (6 percent
adjusted for currency) and Italy was down 8.4 percent (1 percent
adjusted for currency). The EMEA growth markets increased 0.8
percent (5 percent at constant currency) led by growth in Russia
of 11.7 percent (13 percent adjusted for currency).