IBM 2013 Annual Report Download - page 141
Download and view the complete annual report
Please find page 141 of the 2013 IBM annual report below. You can navigate through the pages in the report by either clicking on the pages listed below, or by using the keyword search tool below to find specific information within the annual report.-
 1
1 -
2
-
3
-
4
-
5
-
6
-
7
-
8
-
9
-
10
-
11
-
12
-
13
-
14
-
15
-
16
-
17
-
18
-
19
-
20
-
21
-
22
-
23
-
24
-
25
-
26
-
27
-
28
-
29
-
30
-
31
-
32
-
33
-
34
-
35
-
36
-
37
-
38
-
39
-
40
-
41
-
42
-
43
-
44
-
45
-
46
-
47
-
48
-
49
-
50
-
51
-
52
-
53
-
54
-
55
-
56
-
57
-
58
-
59
-
60
-
61
-
62
-
63
-
64
-
65
-
66
-
67
-
68
-
69
-
70
-
71
-
72
-
73
-
74
-
75
-
76
-
77
-
78
-
79
-
80
-
81
-
82
-
83
-
84
-
85
-
86
-
87
-
88
-
89
-
90
-
91
-
92
-
93
-
94
-
95
-
96
-
97
-
98
-
99
-
100
-
101
-
102
-
103
-
104
-
105
-
106
-
107
-
108
-
109
-
110
-
111
-
112
-
113
-
114
-
115
-
116
-
117
-
118
-
119
-
120
-
121
-
122
-
123
-
124
-
125
-
126
-
127
-
128
-
129
-
130
-
 131
131 -
 132
132 -
 133
133 -
 134
134 -
 135
135 -
 136
136 -
 137
137 -
 138
138 -
 139
139 -
 140
140 -
 141
141 -
 142
142 -
 143
143 -
 144
144 -
 145
145 -
 146
146 -
 147
147 -
 148
148 -
 149
149 -
 150
150 -
 151
151 -
152
-
153
-
154
 |
 |

Notes to Consolidated Financial Statements
International Business Machines Corporation and Subsidiary Companies
140
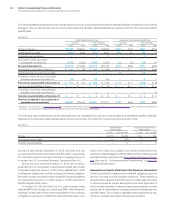
Nonpension Postretirement Benefit Plans
The company contributed $80 million and $693 million to the non-
pension postretirement benefit plans during the years ended
December 31, 2013 and 2012, respectively. These contribution
amounts exclude the Medicare-related subsidy discussed on page
141. The 2012 amount includes a $400 million voluntary cash contribu-
tion to the U.S. nonpension postretirement benefit plan. This advanced
funding was to be utilized to fund post-2012 benefit payments for
Medicare-eligible prescription drugs. In 2013, the prefunding was used
for this purpose. However, effective January 1, 2014, IBM will not be
eligible for the Medicare subsidy. The remainder of the prefunding is
being utilized to fund other eligible benefits under the plan.
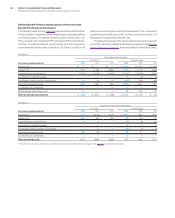
($ in millions)
Qualified
U.S. Plan
Payments
Nonqualified
U.S. Plans
Payments
Qualified
Non-U.S. Plans
Payments
Nonqualified
Non-U.S. Plans
Payments
Tot a l
Expected
Benefit
Payments
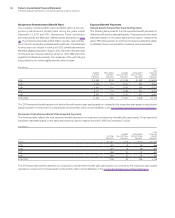
2014 $ 3,393 $109 $ 2,026 $ 382 $ 5,910
2015 3,430 112 2,021 382 5,945
2016 3,460 114 2,062 385 6,022
2017 3,477 116 2,086 394 6,073
2018 3,441 118 2,121 407 6,087
2019–2023 17,454 600 11,327 2,325 31,706
The 2014 expected benefit payments to defined benefit pension plan participants not covered by the respective plan assets (underfunded
plans) represent a component of compensation and benefits, within current liabilities, in the Consolidated Statement of Financial Position.
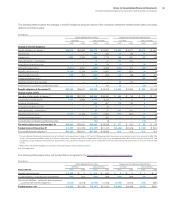
Nonpension Postretirement Benefit Plan Expected Payments
The following table reflects the total expected benefit payments to nonpension postretirement benefit plan participants. These payments
have been estimated based on the same assumptions used to measure the plans’ APBO at December 31, 2013.
($ in millions)
U.S. Plan
Payments
Qualified
Non-U.S. Plans
Payments
Nonqualified
Non-U.S. Plans
Payments
Tot a l
Expected
Benefit
Payments
2014 $ 427 $ 8 $ 32 $ 467
2015 422 8 36 466
2016 416 9 39 464
2017 409 10 42 461
2018 393 10 46 449
2019–2023 1,799 63 286 2,148
The 2014 expected benefit payments to nonpension postretirement benefit plan participants not covered by the respective plan assets
represent a component of compensation and benefits, within current liabilities, in the Consolidated Statement of Financial Position.
Expected Benefit Payments
Defined Benefit Pension Plan Expected Payments
The following table presents the total expected benefit payments to
defined benefit pension plan participants. These payments have been
estimated based on the same assumptions used to measure the
plans’ PBO at December 31, 2013 and include benefits attributable
to estimated future compensation increases, where applicable.