IBM 2013 Annual Report Download - page 39
Download and view the complete annual report
Please find page 39 of the 2013 IBM annual report below. You can navigate through the pages in the report by either clicking on the pages listed below, or by using the keyword search tool below to find specific information within the annual report.-
 1
1 -
2
-
3
-
4
-
5
-
6
-
7
-
8
-
9
-
10
-
11
-
12
-
13
-
14
-
15
-
16
-
17
-
18
-
19
-
20
-
21
-
22
-
23
-
24
-
25
-
26
-
27
-
28
-
 29
29 -
 30
30 -
 31
31 -
 32
32 -
 33
33 -
 34
34 -
 35
35 -
 36
36 -
 37
37 -
 38
38 -
 39
39 -
 40
40 -
 41
41 -
 42
42 -
 43
43 -
 44
44 -
 45
45 -
 46
46 -
 47
47 -
 48
48 -
 49
49 -
50
-
51
-
52
-
53
-
54
-
55
-
56
-
57
-
58
-
59
-
60
-
61
-
62
-
63
-
64
-
65
-
66
-
67
-
68
-
69
-
70
-
71
-
72
-
73
-
74
-
75
-
76
-
77
-
78
-
79
-
80
-
81
-
82
-
83
-
84
-
85
-
86
-
87
-
88
-
89
-
90
-
91
-
92
-
93
-
94
-
95
-
96
-
97
-
98
-
99
-
100
-
101
-
102
-
103
-
104
-
105
-
106
-
107
-
108
-
109
-
110
-
111
-
112
-
113
-
114
-
115
-
116
-
117
-
118
-
119
-
120
-
121
-
122
-
123
-
124
-
125
-
126
-
127
-
128
-
129
-
130
-
131
-
132
-
133
-
134
-
135
-
136
-
137
-
138
-
139
-
140
-
141
-
142
-
143
-
144
-
145
-
146
-
147
-
148
-
149
-
150
-
151
-
152
-
153
-
154
 |
 |

38 Management Discussion
International Business Machines Corporation and Subsidiary Companies
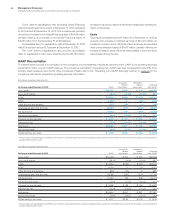
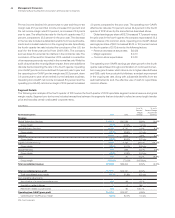
Software
($ in millions)
For the year ended December 31: 2013 2012
Yr.-to-Yr.
Percent
Change
Yr.-to-Yr.
Percent Change
Adjusted for
Currency
Software external revenue $25,932 $25,448 1.9%2.9%
Middleware $21,557 $20,983 2.7%3.7%
Key Branded Middleware 17,322 16,528 4.8 5.7
WebSphere Family 8.2 9.1
Information Management 2.8 3.7
Social Workforce Solutions* 10.8 11.9
Tivoli 3.9 4.8
Rational 4.9 6.0
Other middleware 4,235 4,455 (4.9)(3.9)
Operating systems 2,447 2,525 (3.1) (1.9)
Other 1,929 1,940 (0.6) 0.2
* Formerly Lotus
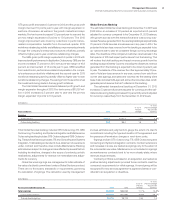
Software revenue of $25,932 million increased 1.9 percent as
reported and 3 percent adjusted for currency in 2013 compared to
2012. The Software business delivered revenue growth, at constant
currency, in all four quarters of the year. Revenue continued to mix
toward key branded middleware with growth in all five brands. The
Software value proposition remains strong for enterprise clients.
Customers continue to increase deployment of the company’s
middleware products and the business is investing and gaining
share in social, mobile, analytics, cloud and security. Some of this is
delivered in a SaaS model, and the company has over 100 SaaS
offerings in its software portfolio. Across the Software brands, there
was strong performance in the growth initiatives that address the
key market trends—Smarter Planet, business analytics and cloud.
The Software business completed eight acquisitions in 2013, adding
to its capabilities in mobile, big data analytics and security. The Soft-
ware business grew segment pre-tax profit 2.7 percent to $11.1 billion
and expanded pre-tax margin 0.5 points.
In January 2014, the company announced a $1 billion investment in
Watson, and it established a new Watson Group within the Software
business. This new unit is dedicated to the development and com-
mercialization of cloud-delivered cognitive innovations.
Key branded middleware revenue increased 4.8 percent (6 percent
adjusted for currency), with strong performance in the areas of analytics,
cloud, mobile, social and security. The faster growing and higher value
branded middleware accounted for 67 percent of total Software revenue
in 2013, an increase of 2 points from 2012.
WebSphere revenue increased 8.2 percent (9 percent adjusted
for currency) in 2013 and gained share. Revenue performance was
driven by double-digit growth in the Commerce offerings, and
growth in Business Integration and the on-premises Application
Server business. Mobile contributed strong revenue growth in 2013.
MobileFirst, the company’s comprehensive portfolio of mobile soft-
ware and services, was introduced in 2013 and extends value to
clients to reach new markets and gain competitive advantage. The
company continues to add capabilities to the WebSphere brand. In
January 2014, the business acquired Aspera, Inc. which provides
best in class transfer speeds for movement of big data.
Information Management revenue increased 2.8 percent (4 per-
cent adjusted for currency) in 2013 compared to 2012. Performance
in 2013 included strong growth in the distributed database offerings,
including Netezza, and content management software.
Tivoli revenue increased 3.9 percent (5 percent adjusted for cur-
rency) in 2013 and gained share, driven by storage growth and the
security solutions portfolio. Tivoli storage revenue was up 7 percent (8
percent adjusted for currency) in 2013. Tivoli security revenue increased
17 percent (19 percent adjusted for currency) and reflects contribution
from the acquisition of Trusteer in the third quarter of 2013, which
extended Tivoli’s data security capabilities further into cloud and mobile
environments. The transformation driven by mobile and cloud comput-
ing is raising the importance of security for enterprise customers. The
company has been building and expanding its security capabilities and
now has 6,000 security experts worldwide, 3,000 patents in security
and 25 security laboratories worldwide across software and services.
Social Workforce Solutions revenue increased 10.8 percent
(12 percent adjusted for currency) in 2013. Performance was driven
by Kenexa, which provides cloud-based recruiting and talent
management solutions.
Rational revenue increased 4.9 percent (6 percent adjusted for
currency) in 2013 year over year.
Operating systems revenue decreased 3.1 percent (2 percent
adjusted for currency) in 2013 compared to 2012, driven by declines in
Systems z and Power Systems.
($ in millions)
For the year ended December 31: 2013 2012
Yr.-to-Yr.
Percent/
Margin
Change
Software
External gross profit $23,032 $22,569 2.0%
External gross profit margin 88.8% 88.7% 0.1 pts.
Pre-tax income $11,106 $10,810 2.7%
Pre-tax margin 38.1% 37.6% 0.5 pts.