IBM 2013 Annual Report Download - page 148
Download and view the complete annual report
Please find page 148 of the 2013 IBM annual report below. You can navigate through the pages in the report by either clicking on the pages listed below, or by using the keyword search tool below to find specific information within the annual report.-
 1
1 -
2
-
3
-
4
-
5
-
6
-
7
-
8
-
9
-
10
-
11
-
12
-
13
-
14
-
15
-
16
-
17
-
18
-
19
-
20
-
21
-
22
-
23
-
24
-
25
-
26
-
27
-
28
-
29
-
30
-
31
-
32
-
33
-
34
-
35
-
36
-
37
-
38
-
39
-
40
-
41
-
42
-
43
-
44
-
45
-
46
-
47
-
48
-
49
-
50
-
51
-
52
-
53
-
54
-
55
-
56
-
57
-
58
-
59
-
60
-
61
-
62
-
63
-
64
-
65
-
66
-
67
-
68
-
69
-
70
-
71
-
72
-
73
-
74
-
75
-
76
-
77
-
78
-
79
-
80
-
81
-
82
-
83
-
84
-
85
-
86
-
87
-
88
-
89
-
90
-
91
-
92
-
93
-
94
-
95
-
96
-
97
-
98
-
99
-
100
-
101
-
102
-
103
-
104
-
105
-
106
-
107
-
108
-
109
-
110
-
111
-
112
-
113
-
114
-
115
-
116
-
117
-
118
-
119
-
120
-
121
-
122
-
123
-
124
-
125
-
126
-
127
-
128
-
129
-
130
-
131
-
132
-
133
-
134
-
135
-
136
-
137
-
 138
138 -
 139
139 -
 140
140 -
 141
141 -
 142
142 -
 143
143 -
 144
144 -
 145
145 -
 146
146 -
 147
147 -
 148
148 -
 149
149 -
 150
150 -
 151
151 -
 152
152 -
 153
153 -
 154
154
 |
 |

147
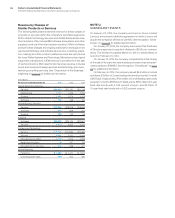
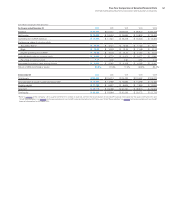
Five-Year Comparison of Selected Financial Data
International Business Machines Corporation and Subsidiary Companies
($ in millions except per share amounts)
For the year ended December 31: 2013 2012 2011 2010 2009
Revenue $ 99,751 $104,507 $106,916 $ 99,870 $ 95,758
Net income $ 16,483 $ 16,604 $ 15,855 $ 14,833 $ 13,425
Operating (non-GAAP) earnings* $ 17,959 $ 17,627 $ 16,318 $ 15,023 $ 13,452
Earnings per share of common stock
Assuming dilution $ 14.94 $ 14.37 $ 13.06 $ 11.52 $ 10.01
Basic $ 15.06 $ 14.53 $ 13.25 $ 11.69 $ 10.12
Diluted operating (non-GAAP)* $ 16.28 $ 15.25 $ 13.44 $ 11.67 $ 10.03
Cash dividends paid on common stock $ 4,058 $ 3,773 $ 3,473 $ 3,177 $ 2,860
Per share of common stock 3.70 3.30 2.90 2.50 2.15
Investment in property, plant and equipment $ 3,623 $ 4,082 $ 4,108 $ 4,185 $ 3,447
Return on IBM stockholders’ equity 83.8% 81.6% 71.2% 66.8% 80.4%
At December 31: 2013 2012 2011 2010 2009
Total assets $126,223 $119,213 $116,433 $113,452 $109,022
Net investment in property, plant and equipment $ 13,821 $ 13,996 $ 13,883 $ 14,096 $ 14,165
Working capital $ 11,196 $ 5,807 $ 8,805 $ 7,554 $ 12,933
Total debt $ 39,718 $ 33,269 $ 31,320 $ 28,624 $ 26,099
Total equity $ 22,929 $ 18,984 $ 20,236 $ 23,172 $ 22,755
* Refer to page 62 of the company’s first-quarter 2011 Form 10-Q filed on April 26, 2011 for the reconciliation of non-GAAP financial information for the years 2009 and 2010 and
“GAAP Reconciliation,” on page 63 for the reconciliation of non-GAAP financial information for 2011. Also see “GAAP Reconciliation,” on page 46 for the reconciliation of non-GAAP
financial information for 2013 and 2012.