IBM 2013 Annual Report Download - page 117
Download and view the complete annual report
Please find page 117 of the 2013 IBM annual report below. You can navigate through the pages in the report by either clicking on the pages listed below, or by using the keyword search tool below to find specific information within the annual report.-
 1
1 -
2
-
3
-
4
-
5
-
6
-
7
-
8
-
9
-
10
-
11
-
12
-
13
-
14
-
15
-
16
-
17
-
18
-
19
-
20
-
21
-
22
-
23
-
24
-
25
-
26
-
27
-
28
-
29
-
30
-
31
-
32
-
33
-
34
-
35
-
36
-
37
-
38
-
39
-
40
-
41
-
42
-
43
-
44
-
45
-
46
-
47
-
48
-
49
-
50
-
51
-
52
-
53
-
54
-
55
-
56
-
57
-
58
-
59
-
60
-
61
-
62
-
63
-
64
-
65
-
66
-
67
-
68
-
69
-
70
-
71
-
72
-
73
-
74
-
75
-
76
-
77
-
78
-
79
-
80
-
81
-
82
-
83
-
84
-
85
-
86
-
87
-
88
-
89
-
90
-
91
-
92
-
93
-
94
-
95
-
96
-
97
-
98
-
99
-
100
-
101
-
102
-
103
-
104
-
105
-
106
-
 107
107 -
 108
108 -
 109
109 -
 110
110 -
 111
111 -
 112
112 -
 113
113 -
 114
114 -
 115
115 -
 116
116 -
 117
117 -
 118
118 -
 119
119 -
 120
120 -
 121
121 -
 122
122 -
 123
123 -
 124
124 -
 125
125 -
 126
126 -
 127
127 -
128
-
129
-
130
-
131
-
132
-
133
-
134
-
135
-
136
-
137
-
138
-
139
-
140
-
141
-
142
-
143
-
144
-
145
-
146
-
147
-
148
-
149
-
150
-
151
-
152
-
153
-
154
 |
 |

Notes to Consolidated Financial Statements
International Business Machines Corporation and Subsidiary Companies
116
NOTE L.
EQUITY ACTIVITY
The authorized capital stock of IBM consists of 4,687,500,000
shares of common stock with a $.20 per share par value, of which
1,054,390,937 shares were outstanding at December 31, 2013 and
150,000,000 shares of preferred stock with a $.01 per share par
value, none of which were outstanding at December 31, 2013.
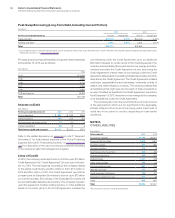
Stock Repurchases
The Board of Directors authorizes the company to repurchase IBM
common stock. The company repurchased 73,121,942 common
shares at a cost of $13,993 million, 61,246,371 common shares at a
cost of $12,008 million and 88,683,716 common shares at a cost of
$15,034 million in 2013, 2012 and 2011, respectively. These amounts
reflect transactions executed through December 31 of each year.
Actual cash disbursements for repurchased shares may differ due
to varying settlement dates for these transactions. At December 31,
2013, $14,659 million of Board common stock repurchase authoriza-
tion was still available. The company plans to purchase shares on the
open market or in private transactions from time to time, depending
on market conditions.
Other Stock Transactions
The company issued the following shares of common stock as part
of its stock-based compensation plans and employees stock pur-
chase plan: 9,961,389 shares in 2013, 15,091,320 shares in 2012,
and 20,669,785 shares in 2011. The company issued 1,849,883
treasury shares in 2013, 2,746,169 treasury shares in 2012 and
4,920,198 treasury shares in 2011, as a result of RSU releases and
exercises of stock options by employees of certain acquired busi-
nesses and by non-U.S. employees. Also, as part of the company’s
stock-based compensation plans, 1,666,069 common shares at a
cost of $336 million, 2,406,007 common shares at a cost of $468
million, and 1,717,246 common shares at a cost of $289 million in
2013, 2012 and 2011, respectively, were remitted by employees to
the company in order to satisfy minimum statutory tax withholding
requirements. These amounts are included in the treasury stock
balance in the Consolidated Statement of Financial Position and the
Consolidated Statement of Changes in Equity.
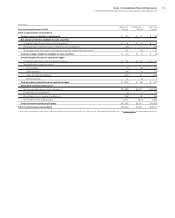
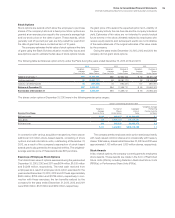
Reclassifications and Taxes Related to Items of Other Comprehensive Income
($ in millions)
For the year ended December 31, 2013:
Before Tax
Amount
Tax (Expense)/
Benefit
Net of Tax
Amount
Other comprehensive income/(loss)
Foreign currency translation adjustments $(1,335) $ (66) $(1,401)
Net changes related to available-for-sale securities
Unrealized gains/(losses) arising during the period $ (4) $ 2 $ (3)
Reclassification of (gains)/losses to other (income) and expense (8)2 (5)
Subsequent changes in previously impaired securities arising during the period 4 (1) 3
Total net changes related to available-for-sale securities $ (8) $ 3 $ (5)
Unrealized gains/(losses) on cash flow hedges
Unrealized gains/(losses) arising during the period $ 43 $ (15) $ 28
Reclassification of (gains)/losses to:
Cost of sales 34 (14) 21
SG&A expense (39) 14 (25)
Other (income) and expense (162) 62 (99)
Interest expense 0 (0) 0
Total unrealized gains/(losses) on cash flow hedges $ (123) $ 47 $ (76)
Retirement-related benefit plans(1)
Prior service costs/(credits) $ 16 $ (0) $ 16
Net (losses)/gains arising during the period 5,369 (1,974) 3,395
Curtailments and settlements (3) 1 (2)
Amortization of prior service (credits)/cost (114) 40 (75)
Amortization of net (gains)/losses 3,499 (1,195) 2,304
Total retirement-related benefit plans $ 8,767 $(3,128) $ 5,639
Other comprehensive income/(loss) $ 7,301 $(3,144) $ 4,157
(1) These AOCI components are included in the computation of net periodic pension cost. (See note S, “Retirement-Related Benefits,” on pages 127 to 141 for additional information.)