IBM 2013 Annual Report Download - page 74
Download and view the complete annual report
Please find page 74 of the 2013 IBM annual report below. You can navigate through the pages in the report by either clicking on the pages listed below, or by using the keyword search tool below to find specific information within the annual report.-
 1
1 -
2
-
3
-
4
-
5
-
6
-
7
-
8
-
9
-
10
-
11
-
12
-
13
-
14
-
15
-
16
-
17
-
18
-
19
-
20
-
21
-
22
-
23
-
24
-
25
-
26
-
27
-
28
-
29
-
30
-
31
-
32
-
33
-
34
-
35
-
36
-
37
-
38
-
39
-
40
-
41
-
42
-
43
-
44
-
45
-
46
-
47
-
48
-
49
-
50
-
51
-
52
-
53
-
54
-
55
-
56
-
57
-
58
-
59
-
60
-
61
-
62
-
63
-
 64
64 -
 65
65 -
 66
66 -
 67
67 -
 68
68 -
 69
69 -
 70
70 -
 71
71 -
 72
72 -
 73
73 -
 74
74 -
 75
75 -
 76
76 -
 77
77 -
 78
78 -
 79
79 -
 80
80 -
 81
81 -
 82
82 -
 83
83 -
 84
84 -
85
-
86
-
87
-
88
-
89
-
90
-
91
-
92
-
93
-
94
-
95
-
96
-
97
-
98
-
99
-
100
-
101
-
102
-
103
-
104
-
105
-
106
-
107
-
108
-
109
-
110
-
111
-
112
-
113
-
114
-
115
-
116
-
117
-
118
-
119
-
120
-
121
-
122
-
123
-
124
-
125
-
126
-
127
-
128
-
129
-
130
-
131
-
132
-
133
-
134
-
135
-
136
-
137
-
138
-
139
-
140
-
141
-
142
-
143
-
144
-
145
-
146
-
147
-
148
-
149
-
150
-
151
-
152
-
153
-
154
 |
 |

73
Management Discussion
International Business Machines Corporation and Subsidiary Companies
financing receivables provisions ($16 million), partially offset by the
decrease in gross profit ($55 million). The increase in financing
receivable provisions in 2013 was due to higher specific reserve
requirements, primarily in China. At December 31, 2013, the overall
allowance for credit losses coverage rate was 1.2 percent, flat com-
pared to the prior year.
The decrease in return on equity from 2012 to 2013 was driven
by a higher average equity balance, and the increase in return on
equity from 2011 to 2012 was driven by higher after-tax income.
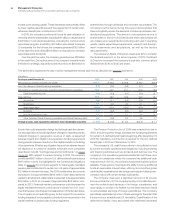
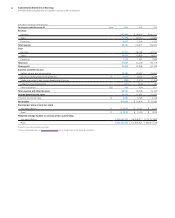
Financial Condition
Balance Sheet
($ in millions)
At December 31: 2013 2012
Cash and cash equivalents $ 1,446 $ 1,380
Net investment in sales-type
and direct financing leases 9,739 10,008
Equipment under operating leases
External clients (a) 947 1,273
Internal clients (b)(c) 025
Client loans 14,297 13,121
Total client financing assets 24,982 24,428
Commercial financing receivables 8,541 7,755
Intercompany financing receivables (b)(c) 4,216 4,328
Other receivables 352 459
Other assets 601 533
Total assets $40,138 $38,882
Intercompany payables
(b) $ 5,766 $ 6,802
Debt (d) 27,504 24,501
Other liabilities 3,043 4,084
Total liabilities 36,314 35,388
Total equity 3,825 3,494
Total liabilities and equity $40,138 $38,882
(a) Includes intercompany mark-up, priced on an arm’s-length basis, on products
purchased from the company’s product divisions, which is eliminated in IBM’s
consolidated results.
(b) Entire amount eliminated for purposes of IBM’s consolidated results and therefore
does not appear on page 80.
(c) These assets, along with all other financing assets in this table, are leveraged at the
value in the table using Global Financing debt.
(d) Global Financing debt is comprised of intercompany loans and external debt.
A portion of Global Financing debt is in support of the company’s internal business,
or related to intercompany mark-up embedded in the Global Financing assets.
See table on page 75.
Sources and Uses of Funds
The primary use of funds in Global Financing is to originate client and
commercial financing assets. Client financing assets for end users
consist primarily of IBM systems, software and services, but also
include OEM equipment, software and services to meet IBM clients’
total solutions requirements. Client financing assets are primarily
sales-type, direct financing and operating leases for systems prod-
ucts, as well as loans for systems, software and services with terms
generally from one to seven years. Global Financing’s client loans are
primarily for software and services and are unsecured. These loans
are subjected to credit analysis to evaluate the associated risk and,
when deemed necessary, actions are taken to mitigate risks in the
loan agreements which include covenants to protect against credit
deterioration during the life of the obligation. Client financing also
includes internal activity as described on pages 33 and 34.
Commercial financing receivables arise primarily from inventory
and accounts receivable financing for dealers and remarketers of
IBM and OEM products. Payment terms for inventory financing and
accounts receivable financing generally range from 30 to 90 days.
These short-term receivables are primarily unsecured and are
also subjected to additional credit analysis in order to evaluate
the associated risk.
In addition to the actions previously described, in certain circum-
stances, the company may take mitigation actions to transfer credit
risk to third parties.
At December 31, 2013, substantially all financing assets are IT
related assets, and approximately 59 percent of the total external
portfolio was with investment-grade clients with no direct exposure
to consumers.
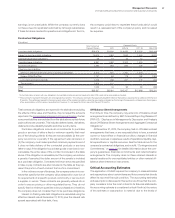
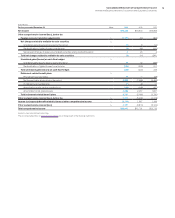
Originations
The following are total financing originations:
($ in millions)
For the year ended December 31: 2013 2012 2011
Client financing $15,792 $16,277 $14,390
Commercial financing 41,027 36,944 35,282
To t a l $56,819 $53,222 $49,673
In 2013, new financing originations exceeded cash collections for
both client and commercial financing. This resulted in a net increase
in total financing assets from December 31, 2012. The increase in
originations in 2013 versus 2012 was due to improving volumes in
commercial financing. The increase in originations in 2012 versus
2011 was due to improving volumes in both client and commercial
financing. Internal loan financing with Global Services is executed
under a loan facility and is not considered originations.
Cash generated by Global Financing in 2013 was deployed to pay
intercompany payables and dividends to IBM as well as business
partners and OEM suppliers.
Global Financing Receivables and Allowances
The following table presents external financing receivables excluding
residual values, and the allowance for credit losses:
($ in millions)
At December 31: 2013 2012
Gross financing receivables $32,319 $30,621
Specific allowance for credit losses 279 240
Unallocated allowance for credit losses 113 115
Total allowance for credit losses 392 355
Net financing receivables $31,928 $30,266
Allowance for credit losses coverage 1.2% 1.2%