IBM 2013 Annual Report Download - page 109
Download and view the complete annual report
Please find page 109 of the 2013 IBM annual report below. You can navigate through the pages in the report by either clicking on the pages listed below, or by using the keyword search tool below to find specific information within the annual report.-
 1
1 -
2
-
3
-
4
-
5
-
6
-
7
-
8
-
9
-
10
-
11
-
12
-
13
-
14
-
15
-
16
-
17
-
18
-
19
-
20
-
21
-
22
-
23
-
24
-
25
-
26
-
27
-
28
-
29
-
30
-
31
-
32
-
33
-
34
-
35
-
36
-
37
-
38
-
39
-
40
-
41
-
42
-
43
-
44
-
45
-
46
-
47
-
48
-
49
-
50
-
51
-
52
-
53
-
54
-
55
-
56
-
57
-
58
-
59
-
60
-
61
-
62
-
63
-
64
-
65
-
66
-
67
-
68
-
69
-
70
-
71
-
72
-
73
-
74
-
75
-
76
-
77
-
78
-
79
-
80
-
81
-
82
-
83
-
84
-
85
-
86
-
87
-
88
-
89
-
90
-
91
-
92
-
93
-
94
-
95
-
96
-
97
-
98
-
 99
99 -
 100
100 -
 101
101 -
 102
102 -
 103
103 -
 104
104 -
 105
105 -
 106
106 -
 107
107 -
 108
108 -
 109
109 -
 110
110 -
 111
111 -
 112
112 -
 113
113 -
 114
114 -
 115
115 -
 116
116 -
 117
117 -
 118
118 -
 119
119 -
120
-
121
-
122
-
123
-
124
-
125
-
126
-
127
-
128
-
129
-
130
-
131
-
132
-
133
-
134
-
135
-
136
-
137
-
138
-
139
-
140
-
141
-
142
-
143
-
144
-
145
-
146
-
147
-
148
-
149
-
150
-
151
-
152
-
153
-
154
 |
 |

Notes to Consolidated Financial Statements
International Business Machines Corporation and Subsidiary Companies
108
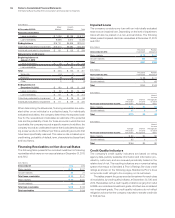
($ in millions)
At December 31, 2012:
Major
Markets
Growth
Markets To ta l
Financing receivables
Lease receivables $ 7,036 $2,138 $ 9,174
Loan receivables 9,666 3,670 13,336
Ending balance $16,701 $5,808 $22,510
Collectively evaluated for impairment $16,570 $5,684 $22,254
Individually evaluated for impairment $ 131 $ 125 $ 256
Allowance for credit losses:
Beginning balance at
January 1, 2012
Lease receivables $ 79 $ 40 $ 118
Loan receivables 125 64 189
To t a l $ 203 $ 104 $ 307
Write-offs (14) (1) (15)
Provision (9) 38 28
Other 0 (2) (2)
Ending balance at
December 31, 2012 $ 180 $ 138 $ 318
Lease receivables $ 59 $ 55 $ 114
Loan receivables $ 121 $ 84 $ 204
Collectively evaluated for impairment $ 69 $ 29 $ 98
Individually evaluated for impairment $ 111 $ 109 $ 220
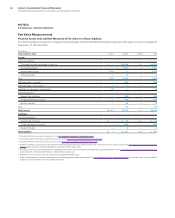
When determining the allowances, financing receivables are evalu-
ated either on an individual or a collective basis. For individually
evaluated receivables, the company determines the expected cash
flow for the receivable and calculates an estimate of the potential
loss and the probability of loss. For those accounts in which the loss
is probable, the company records a specific reserve. In addition, the
company records an unallocated reserve that is calculated by apply-
ing a reserve rate to its different portfolios, excluding accounts that
have been specifically reserved. This reserve rate is based upon
credit rating, probability of default, term, characteristics (lease/loan)
and loss history.
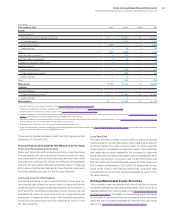
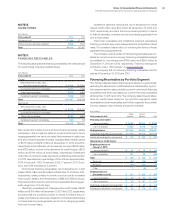
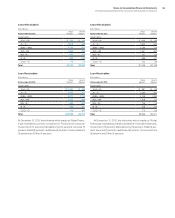
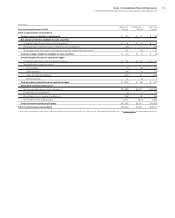
Financing Receivables on Non-Accrual Status
The following table presents the recorded investment in financing
receivables which were on non-accrual status at December 31, 2013
and 2012.
($ in millions)
At December 31: 2013 2012
Major markets $ 25 $ 27
Growth markets 34 21
Total lease receivables $ 59 $ 47
Major markets $ 40 $ 67
Growth markets 92 25
Total loan receivables $132 $ 92
Total receivables $191 $139
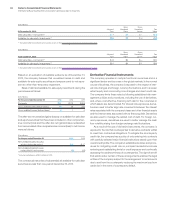
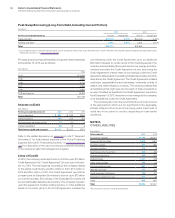
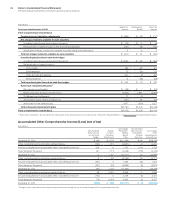
Impaired Loans
The company considers any loan with an individually evaluated
reserve as an impaired loan. Depending on the level of impairment,
loans will also be placed on a non-accrual status. The following
tables present impaired client loan receivables at December 31, 2013
and 2012.
($ in millions)
At December 31, 2013:
Recorded
Investment
Related
Allowance
Major markets $ 79 $ 67
Growth markets 122 116
To t a l $201 $183
($ in millions)
At December 31, 2012:
Recorded
Investment
Related
Allowance
Major markets $ 88 $ 77
Growth markets 72 65
To t a l $160 $143
($ in millions)
For the year ended December 31, 2013:
Average
Recorded
Investment
Interest
Income
Recognized
Interest
Income
Recognized
on Cash
Basis
Major markets $ 76 $0 $0
Growth markets 97 0 0
To t a l $173 $0 $0
($ in millions)
For the year ended December 31, 2012:
Average
Recorded
Investment
Interest
Income
Recognized
Interest
Income
Recognized
on Cash
Basis
Major markets $ 90 $0 $0
Growth markets 65 0 0
To t a l $156 $0 $0
Credit Quality Indicators
The company’s credit quality indicators are based on rating
agency data, publicly available information and information pro-
vided by customers, and are reviewed periodically based on the
relative level of risk. The resulting indicators are a numerical rating
system that maps to Standard & Poor’s Ratings Services credit
ratings as shown on the following page. Standard & Poor’s does
not provide credit ratings to the company on its customers.
The tables present the gross recorded investment for each class
of receivables, by credit quality indicator, at December 31, 2013 and
2012. Receivables with a credit quality indicator ranging from AAA
to BBB- are considered investment grade. All others are considered
non-investment grade. The credit quality indicators do not reflect
mitigation actions that the company may take to transfer credit risk
to third parties.