IBM 2013 Annual Report Download - page 57
Download and view the complete annual report
Please find page 57 of the 2013 IBM annual report below. You can navigate through the pages in the report by either clicking on the pages listed below, or by using the keyword search tool below to find specific information within the annual report.-
 1
1 -
2
-
3
-
4
-
5
-
6
-
7
-
8
-
9
-
10
-
11
-
12
-
13
-
14
-
15
-
16
-
17
-
18
-
19
-
20
-
21
-
22
-
23
-
24
-
25
-
26
-
27
-
28
-
29
-
30
-
31
-
32
-
33
-
34
-
35
-
36
-
37
-
38
-
39
-
40
-
41
-
42
-
43
-
44
-
45
-
46
-
 47
47 -
 48
48 -
 49
49 -
 50
50 -
 51
51 -
 52
52 -
 53
53 -
 54
54 -
 55
55 -
 56
56 -
 57
57 -
 58
58 -
 59
59 -
 60
60 -
 61
61 -
 62
62 -
 63
63 -
 64
64 -
 65
65 -
 66
66 -
 67
67 -
68
-
69
-
70
-
71
-
72
-
73
-
74
-
75
-
76
-
77
-
78
-
79
-
80
-
81
-
82
-
83
-
84
-
85
-
86
-
87
-
88
-
89
-
90
-
91
-
92
-
93
-
94
-
95
-
96
-
97
-
98
-
99
-
100
-
101
-
102
-
103
-
104
-
105
-
106
-
107
-
108
-
109
-
110
-
111
-
112
-
113
-
114
-
115
-
116
-
117
-
118
-
119
-
120
-
121
-
122
-
123
-
124
-
125
-
126
-
127
-
128
-
129
-
130
-
131
-
132
-
133
-
134
-
135
-
136
-
137
-
138
-
139
-
140
-
141
-
142
-
143
-
144
-
145
-
146
-
147
-
148
-
149
-
150
-
151
-
152
-
153
-
154
 |
 |

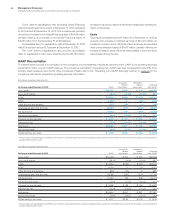
56 Management Discussion
International Business Machines Corporation and Subsidiary Companies
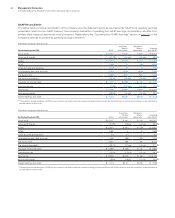
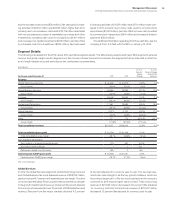
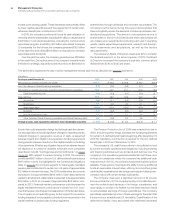
($ in millions)
For the year ended December 31: 2012 2011
Yr.-to-Yr.
Percent
Change
Yr.-to-Yr.
Percent Change
Adjusted for
Currency
Global Services external revenue $58,802 $60,163 (2.3)% 0.4%
Global Technology Services $40,236 $40,879 (1.6)% 1.3%
Outsourcing 23,344 23,911 (2.4)0.5
Integrated Technology Services 9,550 9,453 1.0 3.7
Maintenance 7,343 7,515 (2.3)0.6
Global Business Services $18,566 $19,284 (3.7)% (1.6)%
Outsourcing 4,209 4,390 (4.1)(1.7)
Consulting and Systems Integration 14,358 14,895 (3.6)(1.6)
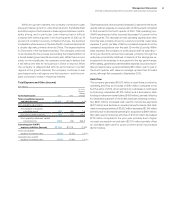
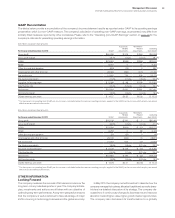
Global Technology Services revenue of $40,236 million in 2012
decreased 1.6 percent as reported, but increased 1 percent
adjusted for currency year to year. Revenue growth from the back-
log was partially offset by a decline in revenue from new signings
and a decrease in sales in existing accounts. Revenue performance
was led by the growth markets which were up 5.0 percent (9 per-
cent adjusted for currency). GTS Outsourcing revenue decreased
2.4 percent as reported, but increased 1 percent adjusted for cur-
rency in 2012. Outsourcing revenue from the growth markets
increased 2.4 percent (7 percent adjusted for currency), as the out-
sourcing offerings help clients build out their IT infrastructures. ITS
revenue increased 1.0 percent (4 percent adjusted for currency) in
2012 compared to 2011, and continued to be led by strength in the
growth markets which increased 10.3 percent (13 percent adjusted
for currency).
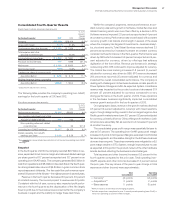
Global Business Services revenue of $18,566 million decreased
3.7 percent (2 percent adjusted for currency) in 2012. On a geo-
graphic basis, solid performance in the growth markets, with
revenue up 4.3 percent (8 percent adjusted for currency), was offset
by a 5.1 percent decline (3 percent adjusted for currency) in the major
markets. The growth initiatives—business analytics, Smarter Planet
and cloud had solid double-digit revenue growth, and represented
over one-third of total GBS revenue in 2012. As GBS shifts more
of its business to higher value content, these larger, more complex
engagements are having a positive effect on the GBS backlog.
The GBS backlog grew for the fourth consecutive year at constant
currency—although the backlog was mixing to longer duration
engagements. Application Outsourcing revenue decreased 4.1 per-
cent (2 percent adjusted for currency) in 2012 year to year, and C&SI
revenue decreased 3.6 percent (2 percent adjusted for currency).
Both GBS lines of business had solid revenue performance year to
year in the growth markets with Application Outsourcing and C&SI
up 1.5 percent and 5.3 percent, respectively, as reported, and up 6
percent and 8 percent, respectively, at constant currency.
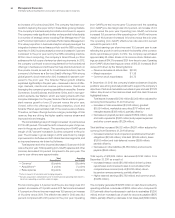
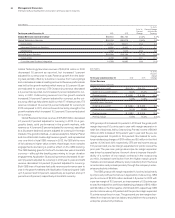
($ in millions)
For the year ended December 31: 2012 2011
Yr.-to-Yr.
Percent/
Margin
Change
Global Services
Global Technology Services
External gross profit $14,740 $14,320 2.9%
External gross profit margin 36.6% 35.0% 1.6 pts.
Pre-tax income $ 6,961 $ 6,284 10.8%
Pre-tax margin 16.8% 14.9%1.9 pts.
Global Business Services
External gross profit $ 5,564 $ 5,545 0.3%
External gross profit margin 30.0% 28.8%1.2 pts.
Pre-tax income $ 2,983 $ 3,006 (0.8)%
Pre-tax margin 15.5%15.0%0.5 pts.
GTS gross profit increased 2.9 percent in 2012 and the gross profit
margin improved 1.6 points year to year with margin expansion in
each line of business, led by Outsourcing. Pre-tax income of $6,961
million in 2012 increased 10.8 percent year to year and the pre-tax
margin expanded 1.9 points to 16.8 percent. Normalized for work-
force rebalancing charges of $151 million and $5 million in the third
quarter of 2012 and 2011, respectively, GTS pre-tax income was up
13.1 percent and pre-tax margin expanded 2.2 points versus the
prior year. The year-over-year gross and pre-tax margin expansion
was driven by several factors: the work done to improve the profit-
ability of a number of low-margin contracts in the outsourcing
portfolio, increased contribution from the higher margin growth
markets, and increased efficiency and productivity from the focus
on automation and process primarily through the company’s enter-
prise productivity initiatives.
The GBS gross profit margin expanded 1.2 points, led primarily
by improved profit performance in Application Outsourcing. GBS
pre-tax income of $2,983 million declined 0.8 percent in 2012 with
a pre-tax margin of 15.5 percent, an improvement of 0.5 points year
to year. Normalized for workforce rebalancing charges of $113 million
and $5 million in the third quarter of 2012 and 2011, respectively, GBS
pre-tax income was up 2.8 percent and the pre-tax margin expanded
1.1 points versus the prior year. The gross and pre-tax margins ben-
efitted from improved service delivery and yield from the company’s
enterprise productivity initiatives.