IBM 2013 Annual Report Download - page 102
Download and view the complete annual report
Please find page 102 of the 2013 IBM annual report below. You can navigate through the pages in the report by either clicking on the pages listed below, or by using the keyword search tool below to find specific information within the annual report.-
 1
1 -
2
-
3
-
4
-
5
-
6
-
7
-
8
-
9
-
10
-
11
-
12
-
13
-
14
-
15
-
16
-
17
-
18
-
19
-
20
-
21
-
22
-
23
-
24
-
25
-
26
-
27
-
28
-
29
-
30
-
31
-
32
-
33
-
34
-
35
-
36
-
37
-
38
-
39
-
40
-
41
-
42
-
43
-
44
-
45
-
46
-
47
-
48
-
49
-
50
-
51
-
52
-
53
-
54
-
55
-
56
-
57
-
58
-
59
-
60
-
61
-
62
-
63
-
64
-
65
-
66
-
67
-
68
-
69
-
70
-
71
-
72
-
73
-
74
-
75
-
76
-
77
-
78
-
79
-
80
-
81
-
82
-
83
-
84
-
85
-
86
-
87
-
88
-
89
-
90
-
91
-
 92
92 -
 93
93 -
 94
94 -
 95
95 -
 96
96 -
 97
97 -
 98
98 -
 99
99 -
 100
100 -
 101
101 -
 102
102 -
 103
103 -
 104
104 -
 105
105 -
 106
106 -
 107
107 -
 108
108 -
 109
109 -
 110
110 -
 111
111 -
 112
112 -
113
-
114
-
115
-
116
-
117
-
118
-
119
-
120
-
121
-
122
-
123
-
124
-
125
-
126
-
127
-
128
-
129
-
130
-
131
-
132
-
133
-
134
-
135
-
136
-
137
-
138
-
139
-
140
-
141
-
142
-
143
-
144
-
145
-
146
-
147
-
148
-
149
-
150
-
151
-
152
-
153
-
154
 |
 |

Notes to Consolidated Financial Statements
International Business Machines Corporation and Subsidiary Companies
101
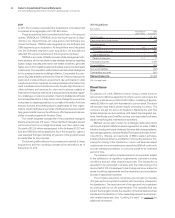
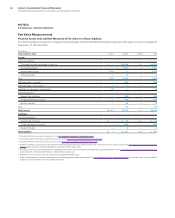
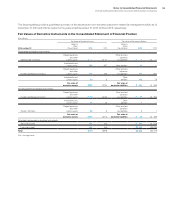
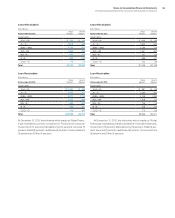
($ in millions)
At December 31, 2012: Level 1 Level 2 Level 3 To t a l
Assets
Cash equivalents (1)
Time deposits and certificates of deposit $ — $3,694 $— $3,694
Commercial paper — 2,098 — 2,098
Money market funds 1,923 — — 1,923
Other securities — 30 — 30
To ta l 1,923 5,823 — 7,746(6)
Debt securities—current (2) — 717 — 717(6)
Debt securities—noncurrent (3) 2 8 — 10
Available-for-sale equity investments (3) 34 — — 34
Derivative assets (4)
Interest rate contracts — 604 — 604
Foreign exchange contracts — 305 — 305
Equity contracts — 9 — 9
To ta l — 918 — 918 (7)
Total assets $1,959 $7,466 $— $9,424 (7)
Liabilities
Derivative liabilities (5)
Foreign exchange contracts $ — $ 496 $— $ 496
Equity contracts — 7 — 7
Total liabilities $ — $ 503 $— $ 503 (7)
(1) Included within cash and cash equivalents in the Consolidated Statement of Financial Position.
(2) Commercial paper and certificates of deposit reported as marketable securities in the Consolidated Statement of Financial Position.
(3) Included within investments and sundry assets in the Consolidated Statement of Financial Position.
(4)
The gross balances of derivative assets contained within prepaid expenses and other current assets, and investments in sundry assets in the Consolidated Statement of Financial
Position at December 31, 2012 were $333 million and $585 million, respectively.
(5)
The gross balances of derivative liabilities contained within other accrued expenses and liabilities, and other liabilities in the Consolidated Statement of Financial Position
at December 31, 2012 were $426 million and $78 million, respectively.
(6) Available-for-sale securities with carrying values that approximate fair value.
(7)
If derivative exposures covered by a qualifying master netting agreement had been netted in the Consolidated Statement of Financial Position, the total derivative asset and liability
positions would have been reduced by $262 million each.
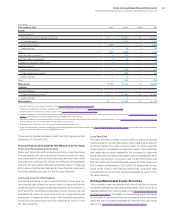
There were no transfers between Levels 1 and 2 for the years ended
December 31, 2013 and 2012.
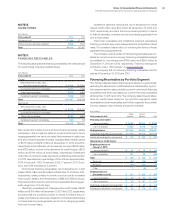
Financial Assets and Liabilities Not Measured at Fair Value
Short-Term Receivables and Payables
Notes and other accounts receivable and other investments are
financial assets with carrying values that approximate fair value.
Accounts payable, other accrued expenses and short-term debt
(excluding the current portion of long-term debt) are financial liabili-
ties with carrying values that approximate fair value. If measured
at fair value in the financial statements, these financial instruments
would be classified as Level 3 in the fair value hierarchy.
Loans and Long-Term Receivables
Fair values are based on discounted future cash flows using cur-
rent interest rates offered for similar loans to clients with similar
credit ratings for the same remaining maturities. At December 31,
2013 and 2012, the difference between the carrying amount and
estimated fair value for loans and long-term receivables was
immaterial. If measured at fair value in the financial statements,
these financial instruments would be classified as Level 3 in the
fair value hierarchy.
Long-Term Debt
Fair value of publicly traded long-term debt is based on quoted
market prices for the identical liability when traded as an asset in
an active market. For other long-term debt for which a quoted
market price is not available, an expected present value technique
that uses rates currently available to the company for debt with
similar terms and remaining maturities is used to estimate fair value.
The carrying amount of long-term debt is $32,856 million and
$24,088 million and the estimated fair value is $34,555 million and
$27,119 million at December 31, 2013 and 2012, respectively. If mea-
sured at fair value in the financial statements, long-term debt
(including the current portion) would be classified as Level 2 in the
fair value hierarchy.
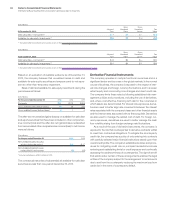
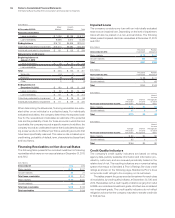
Debt and Marketable Equity Securities
The company’s cash equivalents and current debt securities are
considered available-for-sale and recorded at fair value, which is not
materially different from carrying value, in the Consolidated Statement
of Financial Position. The tables on the following page summarize
the company’s noncurrent debt and marketable equity securities
which are also considered available-for-sale and recorded at fair
value in the Consolidated Statement of Financial Position.