IBM 2013 Annual Report Download - page 53
Download and view the complete annual report
Please find page 53 of the 2013 IBM annual report below. You can navigate through the pages in the report by either clicking on the pages listed below, or by using the keyword search tool below to find specific information within the annual report.-
 1
1 -
2
-
3
-
4
-
5
-
6
-
7
-
8
-
9
-
10
-
11
-
12
-
13
-
14
-
15
-
16
-
17
-
18
-
19
-
20
-
21
-
22
-
23
-
24
-
25
-
26
-
27
-
28
-
29
-
30
-
31
-
32
-
33
-
34
-
35
-
36
-
37
-
38
-
39
-
40
-
41
-
42
-
 43
43 -
 44
44 -
 45
45 -
 46
46 -
 47
47 -
 48
48 -
 49
49 -
 50
50 -
 51
51 -
 52
52 -
 53
53 -
 54
54 -
 55
55 -
 56
56 -
 57
57 -
 58
58 -
 59
59 -
 60
60 -
 61
61 -
 62
62 -
 63
63 -
64
-
65
-
66
-
67
-
68
-
69
-
70
-
71
-
72
-
73
-
74
-
75
-
76
-
77
-
78
-
79
-
80
-
81
-
82
-
83
-
84
-
85
-
86
-
87
-
88
-
89
-
90
-
91
-
92
-
93
-
94
-
95
-
96
-
97
-
98
-
99
-
100
-
101
-
102
-
103
-
104
-
105
-
106
-
107
-
108
-
109
-
110
-
111
-
112
-
113
-
114
-
115
-
116
-
117
-
118
-
119
-
120
-
121
-
122
-
123
-
124
-
125
-
126
-
127
-
128
-
129
-
130
-
131
-
132
-
133
-
134
-
135
-
136
-
137
-
138
-
139
-
140
-
141
-
142
-
143
-
144
-
145
-
146
-
147
-
148
-
149
-
150
-
151
-
152
-
153
-
154
 |
 |

52 Management Discussion
International Business Machines Corporation and Subsidiary Companies
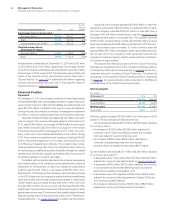
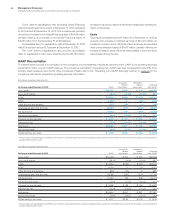
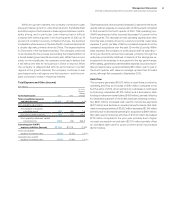
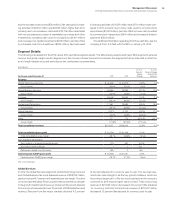
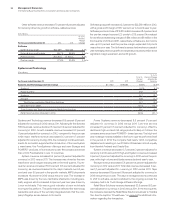
GAAP Reconciliation
The tables below provide a reconciliation of the company’s income statement results as reported under GAAP to its operating earnings
presentation which is a non-GAAP measure. The company’s calculation of operating (non-GAAP) earnings, as presented, may differ from
similarly titled measures reported by other companies. Please refer to the “Operating (non-GAAP) Earnings” section on page 26 for the
company’s rationale for presenting operating earnings information.
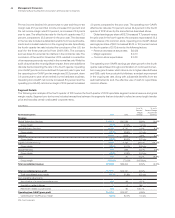
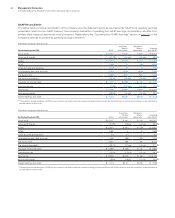
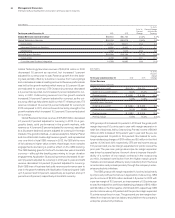
($ in millions except per share amounts)
For the fourth quarter 2013: GAAP
Acquisition-
Related
Adjustments
Retirement-
Related
Adjustments
Operating
(non-GAAP)
Gross profit $14,315 $ 105 $ 154 $14,574
Gross profit margin 51.7%0.4 pts. 0.6 pts. 52.6%
SG&A $ 5,989 $(101) $ (90) $ 5,798
RD&E 1,566 0 (14) 1,552
Other (income) and expense (113) (8) 0 (121)
Total expense and other (income) 7,353 (109) (104) 7,140
Pre-tax income 6,962 213 258 7,434
Pre-tax income margin 25.1%0.8 pts. 0.9 pts. 26.8%
Provision for income taxes* $ 777 $ (55) $ 94 $ 817
Effective tax rate 11.2%(1.1) pts. 0.9 pts. 11.0%
Net income $ 6,185 $ 268 $ 164 $ 6,617
Net income margin 22.3%1.0 pts. 0.6 pts. 23.9%
Diluted earnings per share $ 5.73 $0.25 $0.15 $ 6.13
*
The tax impact on operating (non-GAAP) pre-tax income is calculated under the same accounting principles applied to the GAAP pre-tax income which employs an annual effective
tax rate method to the results.
($ in millions except per share amounts)
For the fourth quarter 2012: GAAP
Acquisition-
Related
Adjustments
Retirement-
Related
Adjustments
Operating
(non-GAAP)
Gross profit $15,167 $ 100 $ 60 $15,327
Gross profit margin 51.8% 0.3 pts. 0.2 pts. 52.3%
SG&A $ 5,921 $ (91) $ (29) $ 5,801
RD&E 1,580 0 6 1,586
Other (income) and expense (47) (7) 0 (54)
Total expense and other (income) 7,336 (98) (23) 7,215
Pre-tax income 7,831 198 83 8,112
Pre-tax income margin 26.7% 0.7 pts. 0.3 pts. 27.7%
Provision for income taxes* $ 1,998 $ (45) $ 30 $ 1,983
Effective tax rate 25.5% (1.2) pts. 0.1 pts. 24.4%
Net income $ 5,833 $ 243 $ 53 $ 6,129
Net income margin 19.9% 0.8 pts. 0.2 pts. 20.9%
Diluted earnings per share $ 5.13 $0.21 $0.05 $ 5.39
*
The tax impact on operating (non-GAAP) pre-tax income is calculated under the same accounting principles applied to the GAAP pre-tax income which employs an annual effective
tax rate method to the results.