IBM 2013 Annual Report Download - page 40
Download and view the complete annual report
Please find page 40 of the 2013 IBM annual report below. You can navigate through the pages in the report by either clicking on the pages listed below, or by using the keyword search tool below to find specific information within the annual report.-
 1
1 -
2
-
3
-
4
-
5
-
6
-
7
-
8
-
9
-
10
-
11
-
12
-
13
-
14
-
15
-
16
-
17
-
18
-
19
-
20
-
21
-
22
-
23
-
24
-
25
-
26
-
27
-
28
-
29
-
 30
30 -
 31
31 -
 32
32 -
 33
33 -
 34
34 -
 35
35 -
 36
36 -
 37
37 -
 38
38 -
 39
39 -
 40
40 -
 41
41 -
 42
42 -
 43
43 -
 44
44 -
 45
45 -
 46
46 -
 47
47 -
 48
48 -
 49
49 -
 50
50 -
51
-
52
-
53
-
54
-
55
-
56
-
57
-
58
-
59
-
60
-
61
-
62
-
63
-
64
-
65
-
66
-
67
-
68
-
69
-
70
-
71
-
72
-
73
-
74
-
75
-
76
-
77
-
78
-
79
-
80
-
81
-
82
-
83
-
84
-
85
-
86
-
87
-
88
-
89
-
90
-
91
-
92
-
93
-
94
-
95
-
96
-
97
-
98
-
99
-
100
-
101
-
102
-
103
-
104
-
105
-
106
-
107
-
108
-
109
-
110
-
111
-
112
-
113
-
114
-
115
-
116
-
117
-
118
-
119
-
120
-
121
-
122
-
123
-
124
-
125
-
126
-
127
-
128
-
129
-
130
-
131
-
132
-
133
-
134
-
135
-
136
-
137
-
138
-
139
-
140
-
141
-
142
-
143
-
144
-
145
-
146
-
147
-
148
-
149
-
150
-
151
-
152
-
153
-
154
 |
 |

39
Management Discussion
International Business Machines Corporation and Subsidiary Companies
enterprise productivity initiatives, to drive profit growth and margin
expansion. The relative strength of the Software business, fueled by
growth in the key growth initiatives, improved the company’s busi-
ness mix and contributed to its operating (non-GAAP) consolidated
gross and net margin improvements.
Software gross profit increased 2.0 percent in 2013, with a gross
profit margin of 88.8 percent. Software pre-tax income increased
2.7 percent and the pre-tax margin improved 0.5 points to 38.1 per-
cent. The Software business had another successful year leveraging
revenue growth and expense savings, primarily from the company’s
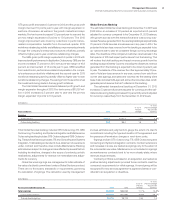
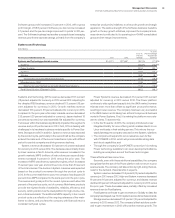
Systems and Technology
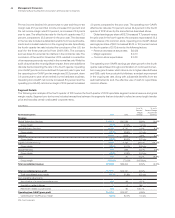
($ in millions)
For the year ended December 31: 2013 2012
Yr.-to-Yr.
Percent
Change
Yr.-to-Yr.
Percent Change
Adjusted for
Currency
Systems and Technology external revenue $14,371 $17,667 (18.7)%(17.9)%
System z (13.4)%(12.6)%
Power Systems (31.4) (30.7)
System x (13.5) (12.7)
Storage (10.8) (9.7)
Total Systems excluding Retail Store Solutions (17.6) (16.8)
Microelectronics OEM (11.9) (11.9)
Total Systems and Technology excluding Retail Store Solutions (17.0) (16.3)
Retail Store Solutions (Divested in 2012) (98.2) (98.2)
Systems and Technology (STG) revenue decreased 18.7 percent
(18 percent adjusted for currency) in 2013 versus 2012. Adjusting for
the divested RSS business, revenue declined 17.0 percent (16 per-
cent adjusted for currency) in 2013. Growth markets revenue
decreased 16.5 percent (16 percent adjusted for currency) in 2013,
compared to the prior year, while major markets revenue decreased
21.5 percent (20 percent adjusted for currency). Japan declined 18
percent as reported, but was essentially flat adjusted for currency.
Two issues within the business significantly impacted the segment’s
revenue and profit performance in 2013. First, STG is dealing with
challenges in its hardware business models specific to Power Sys-
tems, Storage and x86. In addition, System z revenue was impacted
by the product cycle, particularly in the second half, as the company
entered the back end of the current mainframe cycle with difficult
period-to-period comparisons driving revenue declines.
System z revenue decreased 13.4 percent (13 percent adjusted
for currency) in 2013 versus 2012. The decrease was primarily driven
by lower revenue in North America, while revenue increased in the
growth markets. MIPS (millions of instructions per second) ship-
ments increased 6 percent in 2013 versus the prior year. The
increase in MIPS was driven by specialty engines, which increased
17 percent year over year and continue to be more than 50 percent
of the total volumes. The decline in System z revenue was expected
based on the product’s movement through the product cycle in
2013. In the current mainframe cycle, the company has shipped 28
percent more MIPS compared to the same period in the prior cycle.
The revenue and gross profit in the current cycle are each about 99
percent of the previous cycle, net of currency. Mainframe products
provide the highest levels of availability, reliability, efficiency and
security, which position it as the ideal platform for high volume, mis-
sion critical workloads. The additional MIPS capacity in the current
product cycle is a reflection of the ongoing relevance of the main-
frame to clients, and provides the company with financial returns
consistent with past cycles.
Power Systems revenue decreased 31.4 percent (31 percent
adjusted for currency) in 2013 versus 2012. The Power platform
continues to ship significant capacity into the UNIX market, however
this has been more than offset by significant price performance,
resulting in lower revenue. The company has been very successful
in the UNIX market, and is taking two actions to improve its business
model in Power Systems. First, it is making the platform more rele-
vant to clients. To achieve this:
• In the fourth quarter of 2013, the company introduced a new
Integrated Facility for Linux offering which enables clients to run
Linux workloads in their existing servers. This mirrors the suc-
cessful strategy the company executed on the System z platform;
• The company will expand its Linux relevance even further
with POWER8 in 2014, which will provide additional big data
and cloud capabilities; and
•
Through the company’s OpenPOWER consortium it is making
Power technology available to an open development alliance,
building an ecosystem around the Power technologies.
These effects will take some time.
Secondly, even with these additional capabilities, the company
recognizes that the size of the Power platform will not return to prior
revenue levels. The company will take action by right-sizing the busi
-
ness for the demand characteristics it expects.
System x revenue decreased 13.5 percent (13 percent adjusted for
currency) in 2013 versus 2012. High-end System x revenue decreased
16 percent (16 percent adjusted for currency) and blades revenue
declined 45 percent (45 percent adjusted for currency) in 2013 versus
the prior year. These decreases were partially offset by increased
revenue driven by PureSystems.
PureSystems continued to gain momentum. Globally to date, the
company has shipped over 10,000 systems across its hardware brands.
Storage revenue decreased 10.8 percent (10 percent adjusted for
currency) in 2013 versus 2012. The company’s flash solutions contin-
ued to gain momentum in 2013 with positive revenue growth. The