IBM 2013 Annual Report Download - page 52
Download and view the complete annual report
Please find page 52 of the 2013 IBM annual report below. You can navigate through the pages in the report by either clicking on the pages listed below, or by using the keyword search tool below to find specific information within the annual report.-
 1
1 -
2
-
3
-
4
-
5
-
6
-
7
-
8
-
9
-
10
-
11
-
12
-
13
-
14
-
15
-
16
-
17
-
18
-
19
-
20
-
21
-
22
-
23
-
24
-
25
-
26
-
27
-
28
-
29
-
30
-
31
-
32
-
33
-
34
-
35
-
36
-
37
-
38
-
39
-
40
-
41
-
 42
42 -
 43
43 -
 44
44 -
 45
45 -
 46
46 -
 47
47 -
 48
48 -
 49
49 -
 50
50 -
 51
51 -
 52
52 -
 53
53 -
 54
54 -
 55
55 -
 56
56 -
 57
57 -
 58
58 -
 59
59 -
 60
60 -
 61
61 -
 62
62 -
63
-
64
-
65
-
66
-
67
-
68
-
69
-
70
-
71
-
72
-
73
-
74
-
75
-
76
-
77
-
78
-
79
-
80
-
81
-
82
-
83
-
84
-
85
-
86
-
87
-
88
-
89
-
90
-
91
-
92
-
93
-
94
-
95
-
96
-
97
-
98
-
99
-
100
-
101
-
102
-
103
-
104
-
105
-
106
-
107
-
108
-
109
-
110
-
111
-
112
-
113
-
114
-
115
-
116
-
117
-
118
-
119
-
120
-
121
-
122
-
123
-
124
-
125
-
126
-
127
-
128
-
129
-
130
-
131
-
132
-
133
-
134
-
135
-
136
-
137
-
138
-
139
-
140
-
141
-
142
-
143
-
144
-
145
-
146
-
147
-
148
-
149
-
150
-
151
-
152
-
153
-
154
 |
 |

51
Management Discussion
International Business Machines Corporation and Subsidiary Companies
Within the growth markets, the company continued to gain
share and deliver growth in Latin America and in the Middle East
and Africa region. Performance in these regions has been consis-
tently strong, and in particular Latin America had a difficult
compare with revenue growth in the fourth quarter of 2012 up 18
percent at constant currency. In Eastern Europe, the declines
moderated, while revenue in the Asia Pacific countries declined at
a double-digit rate, primarily driven by China. The largest declines
in China were in the hardware business. The company continues
to be impacted by the process surrounding the implementation of
a broad-based governmental economic plan. While there is more
clarity on the overall plan, the company continues to believe that
it will take some time for its business in China to improve. While
the company is disappointed with its performance in certain
regions of the growth markets, the company continues to see
good opportunity in all regions over the long term—and the com-
pany continues to invest in these key markets.
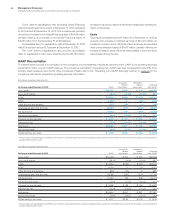
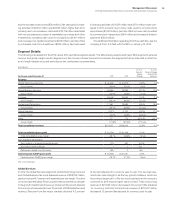
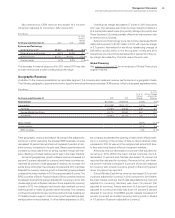
Total Expense and Other (Income)
($ in millions)
For the fourth quarter: 2013 2012
Yr.-to-Yr.
Percent/
Margin
Change
Total consolidated expense
and other (income) $7,353 $7,336 0.2%
Non-operating adjustments
Amortization of acquired
intangible assets (93) (86) 7.9
Acquisition-related charges (16) (12) 33.5
Non-operating retirement-related
(costs)/income (104) (23) 356.8
Operating (non-GAAP)
expense and other (income) $7,140 $7,215 (1.0)%
Total consolidated
expense-to-revenue ratio 26.5% 25.0%1.5 pts.
Operating (non-GAAP)
expense-to-revenue ratio 25.8% 24.6%1.2 pts.
Total expense and other (income) increased 0.2 percent in the fourth
quarter with an expense-to-revenue ratio of 26.5 percent compared
to 25.0 percent in the fourth quarter of 2012. Total operating (non-
GAAP) expense and other (income) decreased 1.0 percent in the
fourth quarter. The decrease in total operating expense and other
(income) was primarily driven by currency (2 points), lower base
expense (1 point), partially offset by increased expense from the
company’s acquisitions over the past 12 months (2 points). Within
base expense, the company is continuing to shift its spending—
driving productivity across the business, primarily through the
enterprise productivity initiatives. A majority of the savings are re-
invested into the business to drive growth in the key growth areas.
Within selling, general and administrative expense, accounts receiv-
able provisions were up approximately $60 million year to year in
the fourth quarter with reserve coverage up less than 20 basis
points, although flat compared to September 2013.
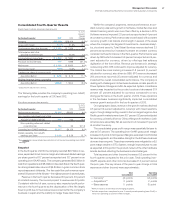
Cash Flow
The company generated $6,528 million in cash flows provided by
operating activities, an increase of $182 million compared to the
fourth quarter of 2012, driven primarily by a decrease in cash used
by financing receivables ($1,218 million) and a decrease in cash
funding of retirement-related plans ($495 million), partially offset by
the December payment of the 401(k) employer matching contribu-
tion ($541 million), increased cash used for income tax payments
($471 million) and declines in operational performance. Net cash
used in investing activities of $2,902 million decreased $1,190 million
primarily due to decreased spending for acquisitions ($961 million).
Net cash used in financing activities of $3,013 million decreased
$779 million compared to the prior year, primarily due to higher
net cash proceeds from total debt ($3,730 million) partially offset
by increased cash used for gross common stock repurchases
($2,791 million).