IBM 2013 Annual Report Download - page 38
Download and view the complete annual report
Please find page 38 of the 2013 IBM annual report below. You can navigate through the pages in the report by either clicking on the pages listed below, or by using the keyword search tool below to find specific information within the annual report.-
 1
1 -
2
-
3
-
4
-
5
-
6
-
7
-
8
-
9
-
10
-
11
-
12
-
13
-
14
-
15
-
16
-
17
-
18
-
19
-
20
-
21
-
22
-
23
-
24
-
25
-
26
-
27
-
 28
28 -
 29
29 -
 30
30 -
 31
31 -
 32
32 -
 33
33 -
 34
34 -
 35
35 -
 36
36 -
 37
37 -
 38
38 -
 39
39 -
 40
40 -
 41
41 -
 42
42 -
 43
43 -
 44
44 -
 45
45 -
 46
46 -
 47
47 -
 48
48 -
49
-
50
-
51
-
52
-
53
-
54
-
55
-
56
-
57
-
58
-
59
-
60
-
61
-
62
-
63
-
64
-
65
-
66
-
67
-
68
-
69
-
70
-
71
-
72
-
73
-
74
-
75
-
76
-
77
-
78
-
79
-
80
-
81
-
82
-
83
-
84
-
85
-
86
-
87
-
88
-
89
-
90
-
91
-
92
-
93
-
94
-
95
-
96
-
97
-
98
-
99
-
100
-
101
-
102
-
103
-
104
-
105
-
106
-
107
-
108
-
109
-
110
-
111
-
112
-
113
-
114
-
115
-
116
-
117
-
118
-
119
-
120
-
121
-
122
-
123
-
124
-
125
-
126
-
127
-
128
-
129
-
130
-
131
-
132
-
133
-
134
-
135
-
136
-
137
-
138
-
139
-
140
-
141
-
142
-
143
-
144
-
145
-
146
-
147
-
148
-
149
-
150
-
151
-
152
-
153
-
154
 |
 |

37
Management Discussion
International Business Machines Corporation and Subsidiary Companies
Global Services Backlog
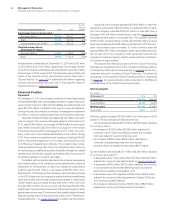
The estimated Global Services backlog at December 31, 2013 was
$143 billion, an increase of 1.8 percent as reported and 5 percent
adjusted for currency compared to the December 31, 2012 balance,
with growth across both the transactional and outsourcing busi-
nesses. Revenue generated from the opening backlog is approximately
70 percent of total services annual revenue in any year. In 2014, the
projected total services revenue from the backlog is expected to be
up 1 percent year to year at consistent foreign currency exchange
rates. The divestiture of the company’s customer care business in the
first quarter of 2014 will impact performance from the backlog. This
will reduce the total backlog and impact revenue growth from the
backlog by approximately 3 points; including the divestiture, revenue
generated from the backlog is expected to be down 2 percent year
to year. The balance of the revenue, the other approximately 30 per-
cent of total services revenue in any year, comes from yield from
current year signings, and sales and volumes into the existing client
base. It also includes SoftLayer and some other cloud services, which
generate period revenue that isn’t reflected in the backlog.
The estimated transactional backlog at December 31, 2013
increased 5.3 percent (8 percent adjusted for currency) and the esti-
mated outsourcing backlog increased 1.5 percent (5 percent adjusted
for currency), respectively, from the December 31, 2012 levels.
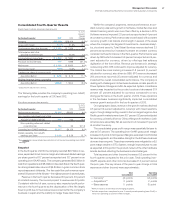
($ in billions)
At December 31: 2013 2012
Yr.-to-Yr.
Percent
Change
Yr.-to-Yr.
Percent Change
Adjusted for
Currency
Backlog
Total backlog $142.8 $140.3 1.8% 4.8%
Outsourcing backlog 90.8 89.4 1.5 4.7
GTS gross profit decreased 0.3 percent in 2013 and the gross profit
margin improved 1.5 points year to year with margin expansion in
each line of business, as well as in the growth markets and major
markets. Pre-tax income increased 0.3 percent year to year and the
pre-tax margin expanded 0.8 points to 17.6 percent. The 2013
margin improvement was driven by reductions in performance-
related compensation, benefits from the second-quarter 2013
workforce rebalancing activity and efficiency improvements primarily
through the company’s enterprise productivity initiatives, partially
offset by higher year-to-year workforce rebalancing charges.
The GBS gross profit margin expanded 0.9 points in 2013 with
improved profit performance in Application Outsourcing. GBS pre-tax
income increased 7.7 percent in 2013 with a pre-tax margin of 16.8
percent, an improvement of 1.3 points year to year. GBS benefitted
from reductions in performance-related compensation, the compa-
ny’s enterprise productivity initiatives and the second-quarter 2013
workforce rebalancing activity, partially offset by higher year-to-year
workforce rebalancing charges. The savings from those actions fuel
the investments being made in the key growth initiatives.
The total Global Services business delivered profit growth and
margin expansion throughout 2013. Pre-tax income of $10,197 mil-
lion in 2013 increased 2.5 percent year to year and the pre-tax
margin expanded 1.0 points to 17.4 percent.
Total Global Services backlog includes GTS Outsourcing, ITS, GBS
Outsourcing, Consulting and Systems Integration and Maintenance.
Outsourcing backlog includes GTS Outsourcing and GBS Outsourc-
ing. Transactional backlog includes ITS and Consulting and Systems
Integration. Total backlog is intended to be a statement of overall work
under contract and therefore does include Maintenance. Backlog
estimates are subject to change and are affected by several factors,
including terminations, changes in the scope of contracts, periodic
revalidations, adjustments for revenue not materialized and adjust
-
ments for currency.
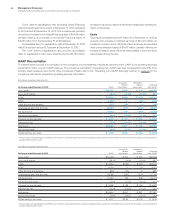
Global Services signings are management’s initial estimate of
the value of a client’s commitment under a Global Services contract.
There are no third-party standards or requirements governing
the calculation of signings. The calculation used by management
involves estimates and judgments to gauge the extent of a client’s
commitment, including the type and duration of the agreement, and
the presence of termination charges or wind-down costs.
Signings include GTS Outsourcing, ITS, GBS Outsourcing and
Consulting and Systems Integration contracts. Contract extensions
and increases in scope are treated as signings only to the extent of
the incremental new value. Maintenance is not included in signings
as maintenance contracts tend to be more steady state, where
revenues equal renewals.
Contract portfolios purchased in an acquisition are treated as
positive backlog adjustments provided those contracts meet the
company’s requirements for initial signings. A new signing will be
recognized if a new services agreement is signed incidental or coin
-
cidental to an acquisition or divestiture.
($ in millions)
For the year ended December 31: 2013 2012
Yr.-to-Yr.
Percent
Change
Yr.-to-Yr.
Percent Change
Adjusted for
Currency
Total signings $63,203 $56,595 11.7%14.8%
Outsourcing signings $35,027 $27,891 25.6%28.7%
Transactional signings 28,176 28,703 (1.8)1.4