IBM 2013 Annual Report Download - page 42
Download and view the complete annual report
Please find page 42 of the 2013 IBM annual report below. You can navigate through the pages in the report by either clicking on the pages listed below, or by using the keyword search tool below to find specific information within the annual report.-
 1
1 -
2
-
3
-
4
-
5
-
6
-
7
-
8
-
9
-
10
-
11
-
12
-
13
-
14
-
15
-
16
-
17
-
18
-
19
-
20
-
21
-
22
-
23
-
24
-
25
-
26
-
27
-
28
-
29
-
30
-
31
-
 32
32 -
 33
33 -
 34
34 -
 35
35 -
 36
36 -
 37
37 -
 38
38 -
 39
39 -
 40
40 -
 41
41 -
 42
42 -
 43
43 -
 44
44 -
 45
45 -
 46
46 -
 47
47 -
 48
48 -
 49
49 -
 50
50 -
 51
51 -
 52
52 -
53
-
54
-
55
-
56
-
57
-
58
-
59
-
60
-
61
-
62
-
63
-
64
-
65
-
66
-
67
-
68
-
69
-
70
-
71
-
72
-
73
-
74
-
75
-
76
-
77
-
78
-
79
-
80
-
81
-
82
-
83
-
84
-
85
-
86
-
87
-
88
-
89
-
90
-
91
-
92
-
93
-
94
-
95
-
96
-
97
-
98
-
99
-
100
-
101
-
102
-
103
-
104
-
105
-
106
-
107
-
108
-
109
-
110
-
111
-
112
-
113
-
114
-
115
-
116
-
117
-
118
-
119
-
120
-
121
-
122
-
123
-
124
-
125
-
126
-
127
-
128
-
129
-
130
-
131
-
132
-
133
-
134
-
135
-
136
-
137
-
138
-
139
-
140
-
141
-
142
-
143
-
144
-
145
-
146
-
147
-
148
-
149
-
150
-
151
-
152
-
153
-
154
 |
 |

41
Management Discussion
International Business Machines Corporation and Subsidiary Companies
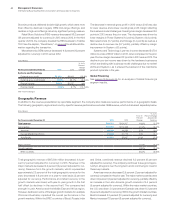
Europe/Middle East/Africa (EMEA) revenue decreased 0.5 per-
cent (2 percent adjusted for currency) compared to the prior year.
The major market countries were down 0.5 percent (3 percent
adjusted for currency), while the growth market countries were down
0.6 percent (up 1 percent adjusted for currency). In the major market
countries, the UK decreased 1.4 percent (flat adjusted for currency),
Germany decreased 0.1 percent (3 percent adjusted for currency),
France decreased 1.8 percent (5 percent adjusted for currency), and
Italy decreased 2.1 percent (5 percent adjusted for currency). Within
the EMEA growth markets, the Middle East and Africa region
increased 5.0 percent (11 percent adjusted for currency), but this
growth was offset primarily by a decrease in Russia of 22.7 percent
(22 percent adjusted for currency).
Asia Pacific revenue decreased 11.6 percent (3 percent adjusted
for currency) year to year. Japan revenue decreased 15.2 percent as
reported, but increased 4 percent overall and grew in every quarter
on a constant currency basis. This growth reflects the benefits of
shifting investment and redirection of the company’s go-to-market
focus to improve performance in Japan. The Asia Pacific growth
markets decreased 9.1 percent (7 percent adjusted for currency),
with China down 12.2 percent (14 percent adjusted for currency) and
Australia down 15.9 percent (10 percent adjusted for currency).
During 2013, performance in China was impacted by the process
surrounding the implementation of a broad governmental economic
reform plan.
OEM revenue of $1,951 million in 2013 decreased 12.9 percent
(12 percent adjusted for currency) compared to the prior year, driven
by the Microelectronics OEM business.
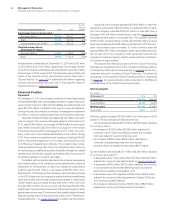
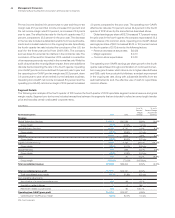
Total Expense and Other (Income)
($ in millions)
For the year ended December 31: 2013 2012
Yr.-to-Yr.
Percent/
Margin
Change
Total consolidated expense
and other (income) $28,981 $28,396 2.1%
Non-operating adjustments
Amortization of acquired
intangible assets (370) (328) 12.9
Acquisition-related charges (40) (35) 14.9
Non-operating retirement-related
(costs)/income (433) (274) 58.3
Operating (non-GAAP)
expense and other (income) $28,137 $27,760 1.4%
Total consolidated
expense-to-revenue ratio 29.1% 27.2% 1.9 pts.
Operating (non-GAAP)
expense-to-revenue ratio 28.2% 26.6%1.6 pts.
Total expense and other (income) increased 2.1 percent in 2013
versus 2012. Total operating (non-GAAP) expense and other
(income) increased 1.4 percent versus the prior year. The key drivers
of the year-to-year change in total expense and other (income) were
approximately:
Total Operating
Consolidated (non-GAAP)
• Currency* (1) point (1) point
• Acquisitions** 2 points 2 points
• Base expense 1 point 1 point
* Reflects impacts of translation and hedging programs.
** Includes acquisitions completed in prior 12-month period.
In the execution of its strategy, the company continues to invest
in its growth initiatives, innovation and strategic acquisitions. The
company also has had an ongoing focus on increasing efficiency
and productivity across the business.
For additional information regarding total expense and other
(income), see the following analyses by category.
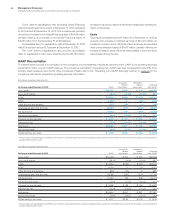
Selling, General and Administrative
($ in millions)
For the year ended December 31: 2013 2012
Yr.-to-Yr.
Percent
Change
Selling, general and
administrative expense
Selling, general and
administrative—other $19,187 $19,589 (2.1)%
Advertising and promotional expense 1,294 1,339 (3.3)
Workforce rebalancing charges 1,064 803 32.4
Retirement-related costs 995 945 5.3
Amortization of acquired
intangible assets 370 328 12.9
Stock-based compensation 435 498 (12.6)
Bad debt expense 156 50 210.0
Total consolidated selling, general
and administrative expense $23,502 $23,553 (0.2)%
Non-operating adjustments
Amortization of acquired
intangible assets (370) (328)12.9
Acquisition-related charges (25) (22)13.3
Non-operating retirement-related
(costs)/income (376) (294)28.1
Operating (non-GAAP)
selling, general and
administrative expense $22,731 $22,910 (0.8)%