IBM 2013 Annual Report Download - page 47
Download and view the complete annual report
Please find page 47 of the 2013 IBM annual report below. You can navigate through the pages in the report by either clicking on the pages listed below, or by using the keyword search tool below to find specific information within the annual report.-
 1
1 -
2
-
3
-
4
-
5
-
6
-
7
-
8
-
9
-
10
-
11
-
12
-
13
-
14
-
15
-
16
-
17
-
18
-
19
-
20
-
21
-
22
-
23
-
24
-
25
-
26
-
27
-
28
-
29
-
30
-
31
-
32
-
33
-
34
-
35
-
36
-
 37
37 -
 38
38 -
 39
39 -
 40
40 -
 41
41 -
 42
42 -
 43
43 -
 44
44 -
 45
45 -
 46
46 -
 47
47 -
 48
48 -
 49
49 -
 50
50 -
 51
51 -
 52
52 -
 53
53 -
 54
54 -
 55
55 -
 56
56 -
 57
57 -
58
-
59
-
60
-
61
-
62
-
63
-
64
-
65
-
66
-
67
-
68
-
69
-
70
-
71
-
72
-
73
-
74
-
75
-
76
-
77
-
78
-
79
-
80
-
81
-
82
-
83
-
84
-
85
-
86
-
87
-
88
-
89
-
90
-
91
-
92
-
93
-
94
-
95
-
96
-
97
-
98
-
99
-
100
-
101
-
102
-
103
-
104
-
105
-
106
-
107
-
108
-
109
-
110
-
111
-
112
-
113
-
114
-
115
-
116
-
117
-
118
-
119
-
120
-
121
-
122
-
123
-
124
-
125
-
126
-
127
-
128
-
129
-
130
-
131
-
132
-
133
-
134
-
135
-
136
-
137
-
138
-
139
-
140
-
141
-
142
-
143
-
144
-
145
-
146
-
147
-
148
-
149
-
150
-
151
-
152
-
153
-
154
 |
 |

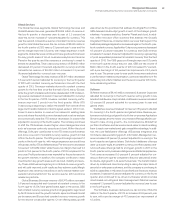
46 Management Discussion
International Business Machines Corporation and Subsidiary Companies
“Core” debt-to-capitalization ratio (excluding Global Financing
debt and equity) was 39.0 percent at December 31, 2013 compared
to 36.1 percent at December 31, 2012. The increase was primarily
driven by an increase in non-Global Financing debt of $3,446 million
partially offset by an increase in non-Global Financing equity of
$3,615 million from the December 31, 2012 balances.
Consolidated debt-to-capitalization ratio at December 31, 2013
was 63.4 percent versus 63.7 percent at December 31, 2012.
The “core” debt-to-capitalization ratio and the consolidated
debt-to-capitalization ratio were impacted by the $3,184 million
increase in equity as a result of retirement-related plan remeasure-
ments in December.
Equity
Total equity increased by $3,945 million from December 31, 2012 as
a result of an increase in retained earnings of $12,401 million, an
increase in common stock of $1,484 million and lower accumulated
other comprehensive losses of $4,157 million, partially offset by an
increase in treasury stock of $14,110 million related to common stock
repurchases during the year.
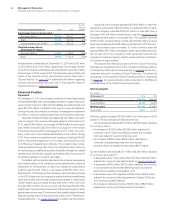
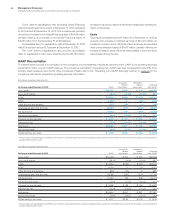
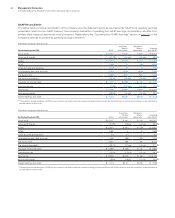
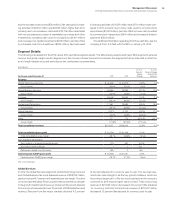
GAAP Reconciliation
The tables below provide a reconciliation of the company’s income statement results as reported under GAAP to its operating earnings
presentation which is a non-GAAP measure. The company’s calculation of operating (non-GAAP) earnings, as presented, may differ from
similarly titled measures reported by other companies. Please refer to the “Operating (non-GAAP) Earnings” section on page 26 for the
company’s rationale for presenting operating earnings information.
($ in millions except per share amounts)
For the year ended December 31, 2013: GAAP
Acquisition-
Related
Adjustments
Retirement-
Related
Adjustments
Operating
(non-GAAP)
Gross profit $48,505 $ 394 $ 629 $49,527
Gross profit margin 48.6% 0.4 pts. 0.6 pts. 49.7%
SG&A $23,502 $(394) $ (376) $22,731
RD&E 6,226 0 (57) 6,170
Other (income) and expense (327) (16) 0 (343)
Total expense and other (income) 28,981 (410) (433) 28,137
Pre-tax income 19,524 804 1,062 21,390
Pre-tax income margin 19.6% 0.8 pts. 1.1 pts. 21.4%
Provision for income taxes* $ 3,041 $ 57 $ 333 $ 3,431
Effective tax rate 15.6% (0.3) pts. 0.8 pts. 16.0%
Net income $16,483 $ 747 $ 729 $17,959
Net income margin 16.5% 0.7 pts. 0.7 pts. 18.0%
Diluted earnings per share $ 14.94 $0.68 $ 0.66 $ 16.28
*
The tax impact on operating (non-GAAP) pre-tax income is calculated under the same accounting principles applied to the GAAP pre-tax income which employs an annual effective
tax rate method to the results.
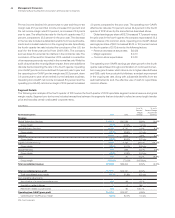
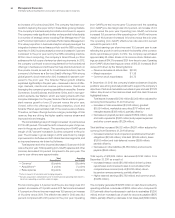
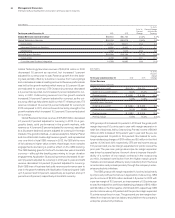
($ in millions except per share amounts)
For the year ended December 31, 2012: GAAP
Acquisition-
Related
Adjustments
Retirement-
Related
Adjustments
Operating
(non-GAAP)
Gross profit $50,298 $ 376 $ 264 $50,938
Gross profit margin 48.1% 0.4 pts. 0.3 pts. 48.7%
SG&A $23,553 $(349) $ (294 )$22,910
RD&E 6,302 0 20 6,322
Other (income) and expense (843) (13) 0 (857)
Total expense and other (income) 28,396 (363) (274)27,760
Pre-tax income 21,902 739 538 23,179
Pre-tax income margin 21.0% 0.7 pts. 0.5 pts. 22.2%
Provision for income taxes* $ 5,298 $ 98 $ 156 $ 5,552
Effective tax rate 24.2% (0.4) pts. 0.1 pts. 24.0%
Net income $16,604 $ 641 $ 381 $17,627
Net income margin 15.9% 0.6 pts. 0.4 pts. 16.9%
Diluted earnings per share $ 14.37 $0.55 $ 0.33 $ 15.25
*
The tax impact on operating (non-GAAP) pre-tax income is calculated under the same accounting principles applied to the GAAP pre-tax income which employs an annual effective
tax rate method to the results.