IBM 2013 Annual Report Download - page 51
Download and view the complete annual report
Please find page 51 of the 2013 IBM annual report below. You can navigate through the pages in the report by either clicking on the pages listed below, or by using the keyword search tool below to find specific information within the annual report.-
 1
1 -
2
-
3
-
4
-
5
-
6
-
7
-
8
-
9
-
10
-
11
-
12
-
13
-
14
-
15
-
16
-
17
-
18
-
19
-
20
-
21
-
22
-
23
-
24
-
25
-
26
-
27
-
28
-
29
-
30
-
31
-
32
-
33
-
34
-
35
-
36
-
37
-
38
-
39
-
40
-
 41
41 -
 42
42 -
 43
43 -
 44
44 -
 45
45 -
 46
46 -
 47
47 -
 48
48 -
 49
49 -
 50
50 -
 51
51 -
 52
52 -
 53
53 -
 54
54 -
 55
55 -
 56
56 -
 57
57 -
 58
58 -
 59
59 -
 60
60 -
 61
61 -
62
-
63
-
64
-
65
-
66
-
67
-
68
-
69
-
70
-
71
-
72
-
73
-
74
-
75
-
76
-
77
-
78
-
79
-
80
-
81
-
82
-
83
-
84
-
85
-
86
-
87
-
88
-
89
-
90
-
91
-
92
-
93
-
94
-
95
-
96
-
97
-
98
-
99
-
100
-
101
-
102
-
103
-
104
-
105
-
106
-
107
-
108
-
109
-
110
-
111
-
112
-
113
-
114
-
115
-
116
-
117
-
118
-
119
-
120
-
121
-
122
-
123
-
124
-
125
-
126
-
127
-
128
-
129
-
130
-
131
-
132
-
133
-
134
-
135
-
136
-
137
-
138
-
139
-
140
-
141
-
142
-
143
-
144
-
145
-
146
-
147
-
148
-
149
-
150
-
151
-
152
-
153
-
154
 |
 |
50 Management Discussion
International Business Machines Corporation and Subsidiary Companies
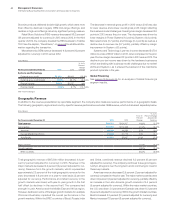
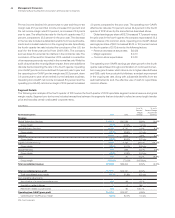
Systems and Technology
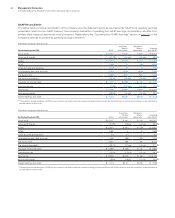
Systems and Technology revenue of $4,261 million decreased 26.1
percent (25 percent adjusted for currency) in the fourth quarter
versus the same period in 2012.
System z revenue decreased 37.4 percent (37 percent adjusted
for currency) in the fourth quarter of 2013 compared to a very strong
fourth quarter of 2012, when revenue increased 56 percent year to
year. During the fourth quarter, the company entered the back end
of the current mainframe cycle and, as expected, delivered a higher
gross margin percentage on a lower base of revenue. Fourth quarter
MIPS shipments decreased 26 percent following the largest MIPS
shipment in mainframe history in the fourth quarter of 2012. In the
current mainframe cycle, the company has shipped 28 percent more
MIPS compared to the same period in the prior cycle. The revenue
and gross profit in the current cycle are each approximately 99 per-
cent of the previous cycle, net of currency. The additional capacity
reflects the ongoing relevance of the mainframe to clients, and pro-
vides the company with financial returns consistent with past cycles.
Power Systems revenue decreased 31.4 percent (31 percent
adjusted for currency) in the fourth quarter. The company continues
to ship significant capacity into the UNIX market, but this has been
more than offset by significant price performance resulting in lower
revenue. The company is taking actions to improve its business
model in Power Systems, including introducing in the fourth quarter
a new Integrated Facility for Linux offering which enables clients to
run Linux workloads in their existing servers. This mirrors the suc-
cessful strategy executed on System z.
System x revenue decreased 15.9 percent (15 percent adjusted
for currency) in the fourth quarter of 2013 versus the fourth quarter
of 2012. PureSystems continues to gain momentum. Across the
hardware product lines, PureSystems revenue was up more than
30 percent in the fourth quarter compared sequentially to the third
quarter of 2013. Globally, the company shipped over 2,500 systems
in fourth quarter, and over 10,000 total systems to date.
Storage revenue decreased 13.4 percent (12 percent adjusted for
currency) in the fourth quarter. The company’s flash solutions con-
tinued to gain momentum and contributed a few points of growth in
the quarter. The Storwize product delivered double-digit growth,
which was offset by declines in the legacy OEM midrange offerings.
Highend offerings declined driven by significant pricing pressure.
Microelectronics OEM revenue decreased 33.0 percent
(33 percent adjusted for currency) in the fourth quarter.
Systems and Technology’s gross profit margin decreased 5.5
points in the fourth quarter of 2013 versus the prior year. The
decrease was driven by lower margins in Power Systems (1.3 points),
System x (1.2 points), Storage (0.6 points), Microelectronics (0.5 points)
and a decline due to revenue mix (2.2 points). Systems and Technol-
ogy’s pre-tax income decreased $768 million or 78.8 percent in the
fourth quarter, and pre-tax margin decreased 11.7 points versus the
prior year period. Approximately half of the fourth-quarter pre-tax
income decline was driven by System z due to the product cycle
dynamics, though the platform remains secularly strong with a solid
business model. The other System & Technology hardware busi-
nesses are dealing with business model challenges due to market
shifts. The company will make these products more relevant while
right-sizing these businesses to meet the new value proposition.
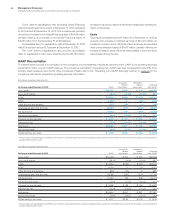
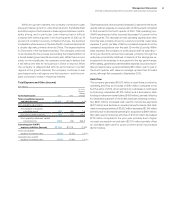
Global Financing
Global Financing revenue of $534 million was essentially flat as
reported and increased 3 percent adjusted for currency, with
increased financing revenue offset by a decrease in used equipment
sales revenue. The Global Financing fourth-quarter pre-tax income
increased 13.8 percent to $589 million and the pre-tax margin
increased 2.7 points to 49.6 percent. The increase in pre-tax income
was driven by the increase in internal gross profit ($118 million), par-
tially offset by increases in financing receivables provisions ($33
million) and SG&A expenses ($14 million).
Geographic Revenue
Total geographic revenue of $27,246 million decreased 4.8 percent
(3 percent adjusted for currency) in the fourth quarter of 2013 compared
to the prior year. In total, the major markets decreased 3.3 percent
(2 percent at constant currency) and the growth markets decreased
9.5 percent as reported and 6 percent at constant currency.
Americas revenue decreased 2.8 percent (2 percent adjusted
for currency) compared to the fourth quarter of 2012. Strong growth
in software was more than offset by the impact from the mainframe
product cycle, predominantly in the U.S. The U.S. was down 3.0
percent and Canada was down 4.5 percent as reported, but
increased 1 percent adjusted for currency. Canada improved their
year-to-year revenue growth rate at constant currency by 3 points
in both the third and fourth quarters of 2013. Revenue in the Latin
America growth markets was essentially flat as reported, but
increased 5 percent at constant currency, led by Brazil which
increased 2.0 percent (7 percent adjusted for currency) year to year.
Europe/Middle East/Africa revenue increased 0.9 percent as
reported, but decreased 2 percent adjusted for currency year to
year, consistent with the third-quarter performance. Western Europe
revenue declined year to year at constant currency in line with the
market, although software performed well. Germany grew 3.9 per-
cent (decreased 1 percent at constant currency) and the UK
increased 3.5 percent (3 percent at constant currency). Italy
decreased 6.1 percent (10 percent adjusted for currency).
Overall, Asia Pacific fourth-quarter revenue decreased 15.8
percent (6 percent adjusted for currency) year over year. Japan
revenue decreased 16.0 percent as reported, but increased 4 per-
cent on a constant currency basis. Adjusted for currency, this was
the fifth consecutive quarter of revenue growth in Japan. The com-
pany has shifted investment and redirected its go-to-market-focus
to significantly improve performance in Japan. The Asia Pacific
growth markets decreased 15.7 percent (12 percent adjusted for
currency) and China was down 22.1 percent (23 percent adjusted
for currency).