IBM 2013 Annual Report Download - page 58
Download and view the complete annual report
Please find page 58 of the 2013 IBM annual report below. You can navigate through the pages in the report by either clicking on the pages listed below, or by using the keyword search tool below to find specific information within the annual report.-
 1
1 -
2
-
3
-
4
-
5
-
6
-
7
-
8
-
9
-
10
-
11
-
12
-
13
-
14
-
15
-
16
-
17
-
18
-
19
-
20
-
21
-
22
-
23
-
24
-
25
-
26
-
27
-
28
-
29
-
30
-
31
-
32
-
33
-
34
-
35
-
36
-
37
-
38
-
39
-
40
-
41
-
42
-
43
-
44
-
45
-
46
-
47
-
 48
48 -
 49
49 -
 50
50 -
 51
51 -
 52
52 -
 53
53 -
 54
54 -
 55
55 -
 56
56 -
 57
57 -
 58
58 -
 59
59 -
 60
60 -
 61
61 -
 62
62 -
 63
63 -
 64
64 -
 65
65 -
 66
66 -
 67
67 -
 68
68 -
69
-
70
-
71
-
72
-
73
-
74
-
75
-
76
-
77
-
78
-
79
-
80
-
81
-
82
-
83
-
84
-
85
-
86
-
87
-
88
-
89
-
90
-
91
-
92
-
93
-
94
-
95
-
96
-
97
-
98
-
99
-
100
-
101
-
102
-
103
-
104
-
105
-
106
-
107
-
108
-
109
-
110
-
111
-
112
-
113
-
114
-
115
-
116
-
117
-
118
-
119
-
120
-
121
-
122
-
123
-
124
-
125
-
126
-
127
-
128
-
129
-
130
-
131
-
132
-
133
-
134
-
135
-
136
-
137
-
138
-
139
-
140
-
141
-
142
-
143
-
144
-
145
-
146
-
147
-
148
-
149
-
150
-
151
-
152
-
153
-
154
 |
 |

57
Management Discussion
International Business Machines Corporation and Subsidiary Companies
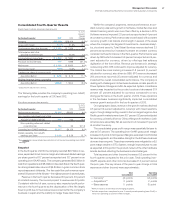
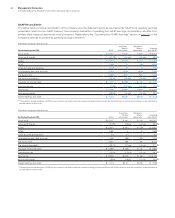
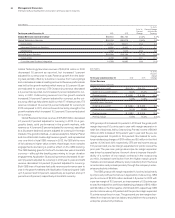
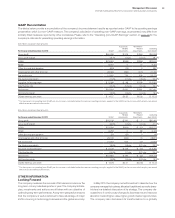
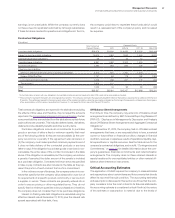
Software
($ in millions)
For the year ended December 31: 2012 2011
Yr.-to-Yr.
Percent
Change
Yr.-to-Yr.
Percent Change
Adjusted for
Currency
Software external revenue $25,448 $24,944 2.0% 4.3%
Middleware $20,983 $20,650 1.6% 3.9%
Key Branded Middleware 16,528 16,055 2.9 5.2
WebSphere Family 7.8 9.9
Information Management 1.5 3.8
Social Workforce Solutions* (2.1) 0.3
Tivoli 4.1 6.2
Rational (1.6) 0.6
Other middleware 4,455 4,596 (3.1) (0.6)
Operating systems 2,525 2,480 1.8 4.3
Other 1,940 1,813 7.0 9.2
* Formerly Lotus
Software revenue of $25,448 million increased 2.0 percent (4 per-
cent adjusted for currency) in 2012 compared to 2011. Software
revenue growth continued to be led by the key branded middleware
products with constant currency growth in all the brands, and par-
ticular strength and share gains in WebSphere and Tivoli. Software
continued its momentum throughout 2012 in the growth initiatives
with strong performance in business analytics, Smarter Commerce
and cloud. The Software business delivered $10.8 billion in segment
pre-tax profit, an increase of $840 million from 2011. The results
reflected the company’s sustained investment in strategic branded
software. In addition to organic investments, acquisitions have pro-
vided additional capabilities, while leveraging the existing portfolio
of offerings. The Software business completed nine acquisitions in
2012, further increasing the company’s capabilities in analytics,
cloud and Smarter Planet.
Key branded middleware revenue increased 2.9 percent (5 percent
adjusted for currency) and again gained market share in 2012, as
the Software business continued to be the leader in the middleware
market. Revenue continued to mix to the faster growing and higher
value branded middleware products which accounted for 65 percent
of total software revenue in 2012, an increase of 1 point from 2011.
WebSphere revenue increased 7.8 percent (10 percent adjusted
for currency) in 2012, with strong performance throughout the year,
and gained share. Revenue performance included strong growth in
the core offerings of commerce and application servers. Commerce
revenue increased 14 percent (15 percent adjusted for currency) and
application server products increased 6 percent (8 percent adjusted
for currency). The company further strengthened its WebSphere
portfolio during the year with the acquisitions of Worklight, DemandTec,
Emptoris and Tealeaf.
Information Management revenue increased 1.5 percent (4 per-
cent adjusted for currency) in 2012 compared to 2011. Performance
was led by growth in the business analytics offerings. The acquisi-
tions of Varicent and Vivisimo expanded the Business Analytics and
Optimization software capabilities. Varicent’s analytics software
helps clients optimize sales performance management. Vivisimo
expands the breadth of the company’s big data capabilities and
creates the most complete end-to-end big data solution for clients.
Tivoli revenue increased 4.1 percent (6 percent adjusted for cur-
rency) in 2012, led by its storage and security offerings, and gained
share. Tivoli storage revenue was up 12 percent (14 percent adjusted
for currency) in 2012, with double-digit constant currency growth in
each quarter, reflecting the value of storage software. Tivoli security
revenue increased 8 percent (10 percent adjusted for currency), with
strong contribution from Q1 Labs which provides next generation
security intelligence.
Social Workforce Solutions revenue decreased 2.1 percent as
reported, but was flat year to year at constant currency in 2012. The
social business offerings performed well, including contribution from
the acquisition of Kenexa, a leading provider of recruiting and talent
management solutions.
Rational revenue decreased 1.6 percent as reported, but increased
1 percent at constant currency in 2012 year over year, and held share.
Operating systems revenue increased 1.8 percent (4 percent
adjusted for currency) in 2012 compared to 2011, driven by Platform
Computing which provides cluster and grid management software
for distributed computing environments.
The total Global Services business delivered strong profit and
margin expansion throughout 2012. Pre-tax income of $9,944 million
in 2012 increased 7.0 percent year to year. Normalized for the higher
level of workforce rebalancing charges in 2012, pre-tax income was
up 9.8 percent and the pre-tax margin expanded 1.9 points compared
to the prior year. The estimated Global Services backlog at December
31, 2012 was $140 billion, a decrease of 0.3 percent as reported,
but an increase of 1 percent adjusted for currency compared to the
December 31, 2011 balance.