IBM 2013 Annual Report Download - page 8
Download and view the complete annual report
Please find page 8 of the 2013 IBM annual report below. You can navigate through the pages in the report by either clicking on the pages listed below, or by using the keyword search tool below to find specific information within the annual report.-
 1
1 -
 2
2 -
 3
3 -
 4
4 -
 5
5 -
 6
6 -
 7
7 -
 8
8 -
 9
9 -
 10
10 -
 11
11 -
 12
12 -
 13
13 -
 14
14 -
 15
15 -
 16
16 -
 17
17 -
 18
18 -
 19
19 -
20
-
21
-
22
-
23
-
24
-
25
-
26
-
27
-
28
-
29
-
30
-
31
-
32
-
33
-
34
-
35
-
36
-
37
-
38
-
39
-
40
-
41
-
42
-
43
-
44
-
45
-
46
-
47
-
48
-
49
-
50
-
51
-
52
-
53
-
54
-
55
-
56
-
57
-
58
-
59
-
60
-
61
-
62
-
63
-
64
-
65
-
66
-
67
-
68
-
69
-
70
-
71
-
72
-
73
-
74
-
75
-
76
-
77
-
78
-
79
-
80
-
81
-
82
-
83
-
84
-
85
-
86
-
87
-
88
-
89
-
90
-
91
-
92
-
93
-
94
-
95
-
96
-
97
-
98
-
99
-
100
-
101
-
102
-
103
-
104
-
105
-
106
-
107
-
108
-
109
-
110
-
111
-
112
-
113
-
114
-
115
-
116
-
117
-
118
-
119
-
120
-
121
-
122
-
123
-
124
-
125
-
126
-
127
-
128
-
129
-
130
-
131
-
132
-
133
-
134
-
135
-
136
-
137
-
138
-
139
-
140
-
141
-
142
-
143
-
144
-
145
-
146
-
147
-
148
-
149
-
150
-
151
-
152
-
153
-
154
 |
 |

2000 2013
7
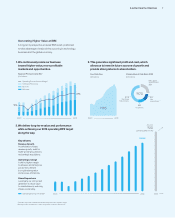
A Letter from the Chairman
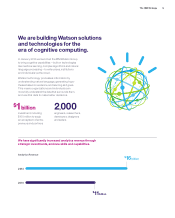
1. We continuously remix our business
toward higher-value, more profitable
markets and opportunities.
Segment Pre-tax Income Mix*
($ in billions)
Key drivers:
Revenue Growth
A combination of base
revenue growth, a shift to
faster-growing businesses
and strategic acquisitions.
Operating Leverage
A shift to higher-margin
businesses and enterprise
productivity derived
from global integration
and process efficiencies.
Share Repurchase
Leveraging our strong cash
generation to return value
to shareholders by reducing
shares outstanding.
* Excludes acquisition-related and nonoperating retirement-related charges.
** Net acquisitions include cash used in acquisitions and from divestitures.
A long-term perspective ensures IBM is well-positioned
to take advantage of major shifts occurring in technology,
business and the global economy.
Generating Higher Value at IBM
Operating Earnings Per Share*
2. This generates significant profit and cash, which
allows us to invest in future sources of growth and
provide strong returns to shareholders.
Free Cash Flow
($ in billions)
Primary Uses of Cash Since 2000
($ in billions)
$165
Net capital
expenditures
Dividends
Net share
repurchases
$59
$
108
$30
$3
2
Net
acquisitions**
$170
Operating Pre-tax Income Margin*
Hardware/Financing
Services
Software
2000 2013
$16.28
2015
$20
At Least
Operating EPS in 2015*
3. We deliver long-term value and performance
while achieving our 2015 operating EPS target
along the way.
2000 2013
10%
2
1%