IBM 2013 Annual Report Download - page 45
Download and view the complete annual report
Please find page 45 of the 2013 IBM annual report below. You can navigate through the pages in the report by either clicking on the pages listed below, or by using the keyword search tool below to find specific information within the annual report.-
 1
1 -
2
-
3
-
4
-
5
-
6
-
7
-
8
-
9
-
10
-
11
-
12
-
13
-
14
-
15
-
16
-
17
-
18
-
19
-
20
-
21
-
22
-
23
-
24
-
25
-
26
-
27
-
28
-
29
-
30
-
31
-
32
-
33
-
34
-
 35
35 -
 36
36 -
 37
37 -
 38
38 -
 39
39 -
 40
40 -
 41
41 -
 42
42 -
 43
43 -
 44
44 -
 45
45 -
 46
46 -
 47
47 -
 48
48 -
 49
49 -
 50
50 -
 51
51 -
 52
52 -
 53
53 -
 54
54 -
 55
55 -
56
-
57
-
58
-
59
-
60
-
61
-
62
-
63
-
64
-
65
-
66
-
67
-
68
-
69
-
70
-
71
-
72
-
73
-
74
-
75
-
76
-
77
-
78
-
79
-
80
-
81
-
82
-
83
-
84
-
85
-
86
-
87
-
88
-
89
-
90
-
91
-
92
-
93
-
94
-
95
-
96
-
97
-
98
-
99
-
100
-
101
-
102
-
103
-
104
-
105
-
106
-
107
-
108
-
109
-
110
-
111
-
112
-
113
-
114
-
115
-
116
-
117
-
118
-
119
-
120
-
121
-
122
-
123
-
124
-
125
-
126
-
127
-
128
-
129
-
130
-
131
-
132
-
133
-
134
-
135
-
136
-
137
-
138
-
139
-
140
-
141
-
142
-
143
-
144
-
145
-
146
-
147
-
148
-
149
-
150
-
151
-
152
-
153
-
154
 |
 |

44 Management Discussion
International Business Machines Corporation and Subsidiary Companies
For the year ended December 31: 2013 2012
Yr.-to-Yr.
Percent
Change
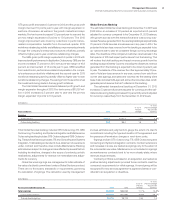
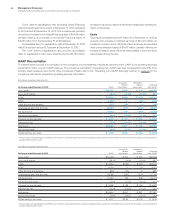
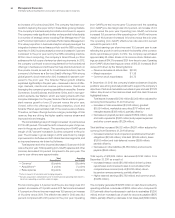
Earnings per share of common stock
Assuming dilution $14.94 $14.37 4.0%
Basic $15.06 $14.53 3.6%
Diluted operating (non-GAAP) $16.28 $15.25 6.8%
Weighted-average shares
outstanding (in millions)
Assuming dilution 1,103.0 1,155.4 (4.5)%
Basic 1,094.5 1,142.5 (4.2)%
Actual shares outstanding at December 31, 2013 and 2012 were
1,054.4 million and 1,117.4 million, respectively. The average number
of common shares outstanding assuming dilution was 52.4 million
shares lower in 2013 versus 2012. The decrease was primarily the
result of the common stock repurchase program. See note L,
“Equity Activity,” on page 116 for additional information regarding
common stock activities. Also see note P, “Earnings Per Share of
Common Stock,” on pages 124 and 125.
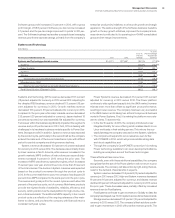
Financial Position
Dynamics
At December 31, 2013, the company continues to have a high degree
of financial flexibility with a strong balance sheet to support the busi-
ness over the long term. Cash and marketable securities at year end
were $11,066 million, consistent with the prior year-end balance.
During the year, the company continued to manage the investment
portfolio to meet its capital preservation and liquidity objectives.
Total debt of $39,718 million increased $6,449 million from prior
year-end levels. The commercial paper balance at December 31,
2013, was $2,458 million, an increase of $658 million from the prior
year. Within total debt, $27,504 million is in support of the Global
Financing business which is leveraged at a 7.2 to 1 ratio. The com-
pany continues to have substantial flexibility in the market. During
2013, the company completed bond issuances totaling $10,956
million, with terms ranging from 2 to 12 years, and priced from 0.22
to 3.38 percent depending on maturity. The company has consis-
tently generated strong cash flow from operations and continues
to have access to additional sources of liquidity through the capital
markets and its $10 billion global credit facility, with 100 percent of
the facility available on a same day basis.
Consistent with accounting standards, the company remeasures
the funded status of its retirement and postretirement plans at
December 31. At December 31, 2013, the overall net underfunded
position was $11,434 million, a decrease of $8,756 million from
December 31, 2012 driven by the increase in discount rates, primarily
in the U.S. At year end, the company’s qualified defined benefit plans
were well funded and the cash requirements related to these plans
remain stable going forward at less than $700 million per year
through 2015. In 2013, the return on the U.S. Personal Pension Plan
assets was 7.1 percent and the plan was 109 percent funded. Overall,
global asset returns were 7.1 percent and the qualified defined benefit
plans worldwide were 102 percent funded. See note S, “Retirement-
Related Benefits,” on pages 127 to 141 for additional information.
During 2013, the company generated $17,485 million in cash from
operations, a decrease of $2,102 million compared to 2012. In addi-
tion, the company generated $15,021 million in free cash flow, a
decrease of $3,164 million versus the prior year. See pages 65 to 67
for additional information on free cash flow. The company returned
$17,917 million to shareholders in 2013, with $13,859 million in gross
share repurchases and $4,058 million in dividends. In 2013 the com-
pany repurchased approximately 73 million shares and had
approximately $14.7 billion remaining in share repurchase authoriza-
tion at year end. The company’s cash generation permits the
company to invest and deploy capital to areas with the most attrac-
tive long-term opportunities.
The assets and debt associated with the Global Financing
business are a significant part of the company’s financial position.
The financial position amounts appearing on page 80 are the con-
solidated amounts including Global Financing. The amounts
appearing in the separate Global Financing section, beginning
on page 72, are supplementary data presented to facilitate an
understanding of the Global Financing business.
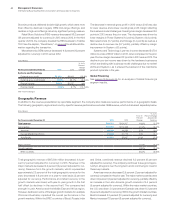
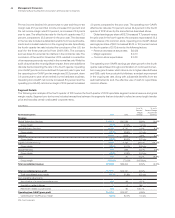
Working Capital
($ in millions)
At December 31: 2013 2012
Current assets $51,350 $49,433
Current liabilities 40,154 43,625
Working capital $11,196 $ 5,807
Current ratio 1.28:1 1.13:1
Working capital increased $5,388 million from the year-end 2012
position. The key changes are described below:
Current assets increased $1,917 million ($2,815 million adjusted
for currency), due to:
• An increase of $1,258 million ($1,886 million adjusted for
currency) in short-term receivables primarily due to higher
volumes related to inventory financing; and
• An increase of $463 million ($630 million adjusted for
currency) in prepaid expenses and other assets,
primarily driven by prepaid income taxes ($407 million).
Current liabilities decreased $3,471 million ($2,562 million adjusted
for currency), as a result of:
• A decrease in short-term debt of $2,319 million ($2,096 million
adjusted for currency) (see debt analysis on pages 45 and 46);
• A decrease of $853 million ($770 million adjusted for currency)
in compensation and benefits reflecting lower accruals for
performance-related compensation; and
• A decrease in accounts payable of $490 million ($409 million
adjusted for currency) reflecting payment of higher 2012 year-
end volumes; partially offset by
• An increase in deferred income of $605 million ($861 million
adjusted for currency) primarily driven by Software.