IBM 2013 Annual Report Download - page 145
Download and view the complete annual report
Please find page 145 of the 2013 IBM annual report below. You can navigate through the pages in the report by either clicking on the pages listed below, or by using the keyword search tool below to find specific information within the annual report.-
 1
1 -
2
-
3
-
4
-
5
-
6
-
7
-
8
-
9
-
10
-
11
-
12
-
13
-
14
-
15
-
16
-
17
-
18
-
19
-
20
-
21
-
22
-
23
-
24
-
25
-
26
-
27
-
28
-
29
-
30
-
31
-
32
-
33
-
34
-
35
-
36
-
37
-
38
-
39
-
40
-
41
-
42
-
43
-
44
-
45
-
46
-
47
-
48
-
49
-
50
-
51
-
52
-
53
-
54
-
55
-
56
-
57
-
58
-
59
-
60
-
61
-
62
-
63
-
64
-
65
-
66
-
67
-
68
-
69
-
70
-
71
-
72
-
73
-
74
-
75
-
76
-
77
-
78
-
79
-
80
-
81
-
82
-
83
-
84
-
85
-
86
-
87
-
88
-
89
-
90
-
91
-
92
-
93
-
94
-
95
-
96
-
97
-
98
-
99
-
100
-
101
-
102
-
103
-
104
-
105
-
106
-
107
-
108
-
109
-
110
-
111
-
112
-
113
-
114
-
115
-
116
-
117
-
118
-
119
-
120
-
121
-
122
-
123
-
124
-
125
-
126
-
127
-
128
-
129
-
130
-
131
-
132
-
133
-
134
-
 135
135 -
 136
136 -
 137
137 -
 138
138 -
 139
139 -
 140
140 -
 141
141 -
 142
142 -
 143
143 -
 144
144 -
 145
145 -
 146
146 -
 147
147 -
 148
148 -
 149
149 -
 150
150 -
 151
151 -
 152
152 -
 153
153 -
 154
154
 |
 |

Notes to Consolidated Financial Statements
International Business Machines Corporation and Subsidiary Companies
144
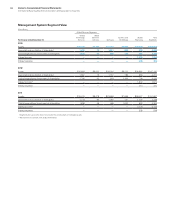
Management System Segment View
($ in millions)
Global Services Segments
For the year ended December 31:
Global
Technology
Services
Global
Business
Services Software
Systems and
Technology
Global
Financing
Tot a l
Segments
2013
Assets $18,048 $8,311 $27,101 $7,960 $40,138 $101,558
Depreciation/amortization of intangibles* 1,670 72 1,211 855 574 4,383
Capital expenditures/investments in intangibles 1,938 69 540 781 467 3,796
Interest income — — — — 1,904 1,904
Interest expense — — — — 405 405
2012
Assets $15,884 $8,022 $26,291 $8,232 $38,882 $ 97,310
Depreciation/amortization of intangibles* 1,597 75 1,157 786 853 4,470
Capital expenditures/investments in intangibles 1,760 42 618 1,106 708 4,233
Interest income** — — — — 1,972 1,972
Interest expense — — — — 410 410
2011
Assets $15,475 $8,078 $23,926 $7,649 $36,427 $ 91,557
Depreciation/amortization of intangibles* 1,713 83 1,062 737 1,145 4,739
Capital expenditures/investments in intangibles 1,838 56 469 1,032 930 4,325
Interest income** — — — — 2,176 2,176
Interest expense — — — — 538 538
* Segment pre-tax income does not include the amortization of intangible assets.
** Reclassified to conform with 2013 presentation.