IBM 2013 Annual Report Download - page 115
Download and view the complete annual report
Please find page 115 of the 2013 IBM annual report below. You can navigate through the pages in the report by either clicking on the pages listed below, or by using the keyword search tool below to find specific information within the annual report.-
 1
1 -
2
-
3
-
4
-
5
-
6
-
7
-
8
-
9
-
10
-
11
-
12
-
13
-
14
-
15
-
16
-
17
-
18
-
19
-
20
-
21
-
22
-
23
-
24
-
25
-
26
-
27
-
28
-
29
-
30
-
31
-
32
-
33
-
34
-
35
-
36
-
37
-
38
-
39
-
40
-
41
-
42
-
43
-
44
-
45
-
46
-
47
-
48
-
49
-
50
-
51
-
52
-
53
-
54
-
55
-
56
-
57
-
58
-
59
-
60
-
61
-
62
-
63
-
64
-
65
-
66
-
67
-
68
-
69
-
70
-
71
-
72
-
73
-
74
-
75
-
76
-
77
-
78
-
79
-
80
-
81
-
82
-
83
-
84
-
85
-
86
-
87
-
88
-
89
-
90
-
91
-
92
-
93
-
94
-
95
-
96
-
97
-
98
-
99
-
100
-
101
-
102
-
103
-
104
-
 105
105 -
 106
106 -
 107
107 -
 108
108 -
 109
109 -
 110
110 -
 111
111 -
 112
112 -
 113
113 -
 114
114 -
 115
115 -
 116
116 -
 117
117 -
 118
118 -
 119
119 -
 120
120 -
 121
121 -
 122
122 -
 123
123 -
 124
124 -
 125
125 -
126
-
127
-
128
-
129
-
130
-
131
-
132
-
133
-
134
-
135
-
136
-
137
-
138
-
139
-
140
-
141
-
142
-
143
-
144
-
145
-
146
-
147
-
148
-
149
-
150
-
151
-
152
-
153
-
154
 |
 |

Notes to Consolidated Financial Statements
International Business Machines Corporation and Subsidiary Companies
114
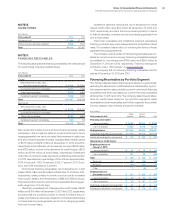
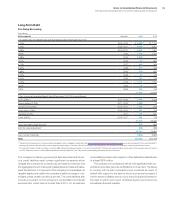
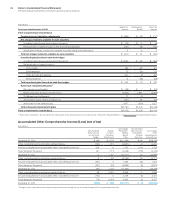
Pre-swap annual contractual maturities of long-term debt outstanding
at December 31, 2013, are as follows:
($ in millions)
To t a l
2014 $ 3,854
2015 4,566
2016 4,114
2017 5,386
2018 2,662
2019 and beyond 16,453
To t a l $37,036
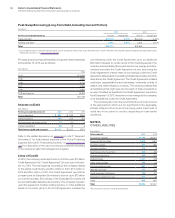
Interest on Debt
($ in millions)
For the year ended December 31: 2013 2012 2011
Cost of financing $ 587 $ 545 $553
Interest expense 405 470 402
Net investment derivative activity (3)(11) 9
Interest capitalized 22 18 9
Total interest paid and accrued $1,011 $1,022 $973
Refer to the related discussion on page 143 in note T, “Seg ment
Infor mation,” for total interest expense of the Global Financing
segment. See note D, “Financial Instruments,” on pages 102 through
106 for a discussion of the use of currency and interest rate swaps
in the company’s debt risk management program.
Lines of Credit
In 2013, the company extended the term of its five-year, $10 billion
Credit Agreement (the “Credit Agreement”) by one year to Novem-
ber 10, 2018. The total expense recorded by the company related
to this global credit facility was $5.4 million in 2013, $5.3 million in
2012 and $5.0 million in 2011. The Credit Agreement permits the
company and its Subsidiary Borrowers to borrow up to $10 billion
on a revolving basis. Borrowings of the Subsidiary Borrowers will
be unconditionally backed by the company. The company may also,
upon the agreement of either existing lenders, or of the additional
banks not currently party to the Credit Agreement, increase the
commitments under the Credit Agreement up to an additional
$2.0 billion. Subject to certain terms of the Credit Agreement, the
company and Subsidiary Borrowers may borrow, prepay and rebor
-
row amounts under the Credit Agreement at any time during the
Credit Agreement. Interest rates on borrowings under the Credit
Agreement will be based on prevailing market interest rates, as further
described in the Credit Agreement. The Credit Agreement contains
customary representations and warranties, covenants, events of
default, and indemnification provisions. The company believes that
circumstances that might give rise to breach of these covenants or
an event of default, as specified in the Credit Agreement, are remote.
As of December 31, 2013, there were no borrowings by the company,
or its subsidiaries, under the Credit Agreement.
The company also has other committed lines of credit in some
of the geographies which are not significant in the aggregate.
Interest rates and other terms of borrowing under these lines of
credit vary from country to country, depending on local market
conditions.
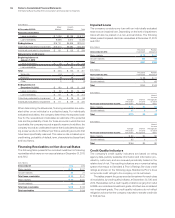
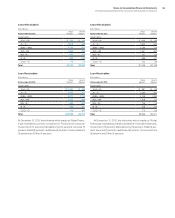
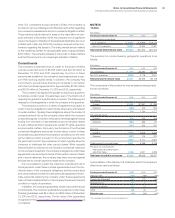
NOTE K.
OTHER LIABILITIES
($ in millions)
At December 31: 2013 2012*
Income tax reserves $3,189 $2,527
Excess 401(k) Plus Plan 1,673 1,501
Disability benefits 699 890
Derivative liabilities 126 78
Special restructuring actions 440 430
Workforce reductions 500 473
Deferred taxes 1,741 448
Other taxes payable 186 24
Environmental accruals 231 216
Warranty accruals 171 167
Asset retirement obligations 129 127
Acquisition-related accruals 205 35
Other 644 691
To t a l $9,934 $7,607
* Reclassified to conform with 2013 presentation.
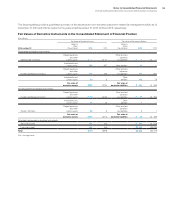
Post-Swap Borrowing (Long-Term Debt, Including Current Portion)
(in millions)
2013 2012
For the year ended December 31: Amount Average Rate Amount Average Rate
Fixed-rate debt $30,123 3.07% $24,049 3.43%
Floating-rate debt* 6,587 0.87% 5,631 1.91%
To t a l $36,710 $29,680
* Includes $3,106 million in 2013 and $4,252 million in 2012 of notional interest rate swaps that effectively convert the fixed-rate long-term debt into floating-rate debt. (See note D,
“Financial Instruments,” on pages 102 through 106.)