IBM 2013 Annual Report Download - page 54
Download and view the complete annual report
Please find page 54 of the 2013 IBM annual report below. You can navigate through the pages in the report by either clicking on the pages listed below, or by using the keyword search tool below to find specific information within the annual report.-
 1
1 -
2
-
3
-
4
-
5
-
6
-
7
-
8
-
9
-
10
-
11
-
12
-
13
-
14
-
15
-
16
-
17
-
18
-
19
-
20
-
21
-
22
-
23
-
24
-
25
-
26
-
27
-
28
-
29
-
30
-
31
-
32
-
33
-
34
-
35
-
36
-
37
-
38
-
39
-
40
-
41
-
42
-
43
-
 44
44 -
 45
45 -
 46
46 -
 47
47 -
 48
48 -
 49
49 -
 50
50 -
 51
51 -
 52
52 -
 53
53 -
 54
54 -
 55
55 -
 56
56 -
 57
57 -
 58
58 -
 59
59 -
 60
60 -
 61
61 -
 62
62 -
 63
63 -
 64
64 -
65
-
66
-
67
-
68
-
69
-
70
-
71
-
72
-
73
-
74
-
75
-
76
-
77
-
78
-
79
-
80
-
81
-
82
-
83
-
84
-
85
-
86
-
87
-
88
-
89
-
90
-
91
-
92
-
93
-
94
-
95
-
96
-
97
-
98
-
99
-
100
-
101
-
102
-
103
-
104
-
105
-
106
-
107
-
108
-
109
-
110
-
111
-
112
-
113
-
114
-
115
-
116
-
117
-
118
-
119
-
120
-
121
-
122
-
123
-
124
-
125
-
126
-
127
-
128
-
129
-
130
-
131
-
132
-
133
-
134
-
135
-
136
-
137
-
138
-
139
-
140
-
141
-
142
-
143
-
144
-
145
-
146
-
147
-
148
-
149
-
150
-
151
-
152
-
153
-
154
 |
 |

53
Management Discussion
International Business Machines Corporation and Subsidiary Companies
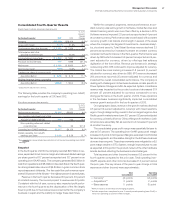
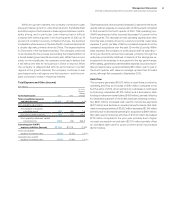
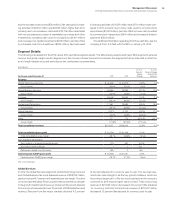
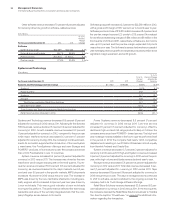
PRIOR YEAR IN REVIEW
The “Prior Year in Review” section provides a summary of the
company’s financial performance in 2012 as compared to 2011.
For a detailed discussion of prior-year performance, see the 2012
Annual Report.
($ and shares in millions except per share amounts)
For the year ended December 31: 2012 2011
Yr.-to-Yr.
Percent/
Margin
Change
Revenue $104,507 $106,916 (2.3)%*
Gross profit margin 48.1% 46.9% 1.2 pts.
Total expense and other (income) $ 28,396 $ 29,135 (2.5)%
Total expense and other
(income)-to-revenue ratio 27.2% 27.3%(0.1 )pts.
Income before income taxes $ 21,902 $ 21,003 4.3%
Provision for income taxes 5,298 5,148 2.9%
Net income $ 16,604 $ 15,855 4.7%
Net income margin 15.9% 14.8%1.1 pts.
Earnings per share of common stock
Assuming dilution $ 14.37 $ 13.06 10.0%
Weighted-average shares outstanding
Assuming dilution 1,155.4 1,213.8 (4.8)%
Assets** $119,213 $116,433 2.4%
Liabilities** $100,229 $ 96,197 4.2%
Equity** $ 18,984 $ 20,236 (6.2)%
* 0.0 percent adjusted for currency.
** At December 31.
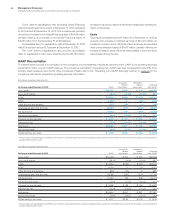
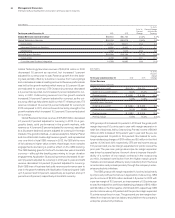
The following table provides the company’s operating (non-GAAP)
earnings for 2012 and 2011.
($ in millions except per share amounts)
For the year ended December 31: 2012 2011
Yr.-to-Yr.
Percent
Change
Net income as reported $16,604 $15,855 4.7%
Non-operating adjustments
(net of tax)
Acquisition-related charges 641 495 29.5
Non-operating retirement-related
costs/(income) 381 (32)NM
Operating (non-GAAP) earnings* $17,627 $16,318 8.0%
Diluted operating (non-GAAP)
earnings per share $ 15.25 $ 13.44 13.5%
NM—Not meaningful
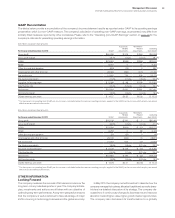
* See page 63 for a more detailed reconciliation of net income to operating (non-GAAP)
earnings.
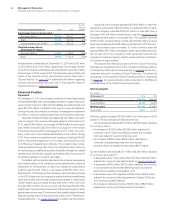
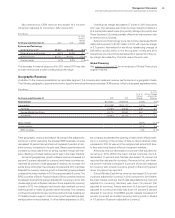
Snapshot
In 2012, the company reported revenue of $104.5 billion, expanded
gross, pre-tax and net income margins, and delivered diluted earn-
ings per share growth of 10.0 percent as reported and 13.5 percent
on an operating (non-GAAP) basis. This was the 10th consecutive
year of double-digit earnings per share growth for the company. The
company generated $19.6 billion in cash from operations, and $18.2
billion in free cash flow driving shareholder returns of $15.8 billion in
gross common stock repurchases and dividends. The free cash
flow performance in 2012 was $12.3 billion greater than the company
generated in 2002. The financial results demonstrated the strength
and flexibility of the company’s business model, which is designed
to deliver profit and cash on a sustained basis.
The company continued to deliver value to its clients and capital-
ize on key trends in 2012. The company had strong performance in
business analytics, cloud and Smarter Planet—key growth initiatives
that leverage the software portfolio and contribute to margin expan-
sion. Within the growth markets, the company continued to expand
its capabilities and build out IT infrastructures in emerging markets.
In 2012, the growth markets revenue growth rate at constant cur-
rency outpaced the major markets by 8 points. The company
continued to invest for innovation and technological leadership.
These investments supported the introduction of the new System
z mainframe, storage and POWER7+ products in hardware, as well
as a series of major launches across software that included more
than 400 new or upgraded product announcements. The introduc-
tion of PureSystems, a new category of expert integrated systems,
brought together hardware and software and provided built-in
expertise to deliver a more efficient and effective solution to the
company’s clients. In addition, the company was awarded more U.S.
patents in 2012 than any other company for the 20th consecutive
year, with many of the patents in key areas such as business analytics,
Big Data, cybersecurity, cloud, mobile, social networking and soft-
ware-defined environments. The company also continued to add to
its capabilities to support the growth initiatives by acquiring 11 com-
panies in 2012—investing approximately $4 billion. At the same time,
the company divested its RSS business as it focused the Smarter
Commerce portfolio on higher value, intellectual property-based
opportunities. Throughout the year, the company continued the
transformation of the business—shifting to higher value areas and
improving its structure—resulting in a higher quality revenue stream
and margin expansion.
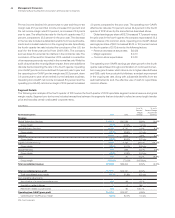
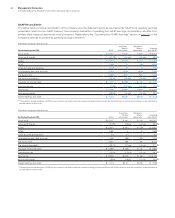
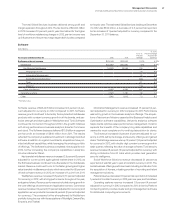
Segment performance was led by Software which increased
revenue 2.0 percent (4 percent adjusted for currency) driven by key
branded middleware which increased 2.9 percent (5 percent
adjusted for currency). Global Services revenue decreased 2.3 per-
cent as reported, but was up 0.4 percent on a constant currency
basis. Global Services revenue performance was led by the growth
markets which were up 4.8 percent (9 percent adjusted for currency)
and represented more than 20 percent of total Global Services rev-
enue. Systems and Technology revenue decreased 6.9 percent;
adjusting for the divested RSS business, revenue declined 5.1 percent
(4 percent adjusted for currency). The company’s new mainframe
was well received in the market, with System z revenue increasing
5.4 percent (6 percent adjusted for currency) versus the prior year.
Global Financing revenue decreased 4.2 percent as reported, 1 per-
cent on a constant currency basis, compared to the prior year.
Across all of the segments, the company continued to have strong
performance in its key growth initiatives. These are not stand-alone
offerings; they are integrated into the overall client offerings and are
included in the financial results of the segments. In the growth mar-
kets, revenue increased 4.2 percent (7 percent adjusted for currency)
year to year and represented 24 percent of total geographic revenue,