IBM 2013 Annual Report Download - page 73
Download and view the complete annual report
Please find page 73 of the 2013 IBM annual report below. You can navigate through the pages in the report by either clicking on the pages listed below, or by using the keyword search tool below to find specific information within the annual report.-
 1
1 -
2
-
3
-
4
-
5
-
6
-
7
-
8
-
9
-
10
-
11
-
12
-
13
-
14
-
15
-
16
-
17
-
18
-
19
-
20
-
21
-
22
-
23
-
24
-
25
-
26
-
27
-
28
-
29
-
30
-
31
-
32
-
33
-
34
-
35
-
36
-
37
-
38
-
39
-
40
-
41
-
42
-
43
-
44
-
45
-
46
-
47
-
48
-
49
-
50
-
51
-
52
-
53
-
54
-
55
-
56
-
57
-
58
-
59
-
60
-
61
-
62
-
 63
63 -
 64
64 -
 65
65 -
 66
66 -
 67
67 -
 68
68 -
 69
69 -
 70
70 -
 71
71 -
 72
72 -
 73
73 -
 74
74 -
 75
75 -
 76
76 -
 77
77 -
 78
78 -
 79
79 -
 80
80 -
 81
81 -
 82
82 -
 83
83 -
84
-
85
-
86
-
87
-
88
-
89
-
90
-
91
-
92
-
93
-
94
-
95
-
96
-
97
-
98
-
99
-
100
-
101
-
102
-
103
-
104
-
105
-
106
-
107
-
108
-
109
-
110
-
111
-
112
-
113
-
114
-
115
-
116
-
117
-
118
-
119
-
120
-
121
-
122
-
123
-
124
-
125
-
126
-
127
-
128
-
129
-
130
-
131
-
132
-
133
-
134
-
135
-
136
-
137
-
138
-
139
-
140
-
141
-
142
-
143
-
144
-
145
-
146
-
147
-
148
-
149
-
150
-
151
-
152
-
153
-
154
 |
 |

72 Management Discussion
International Business Machines Corporation and Subsidiary Companies
As a globally integrated enterprise, the company operates in more than
175 countries and is continuing to shift its business to the higher value
segments of enterprise computing. The company continually assesses
its resource needs with the objective of balancing its workforce glob-
ally to improve the company’s global reach and competitiveness.
The complementary workforce is an approximation of equivalent
full-time employees hired under temporary, part-time and limited-
term employment arrangements to meet specific business needs
in a flexible and cost-effective manner.
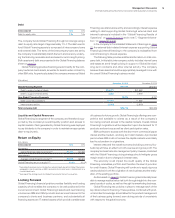
GLOBAL FINANCING
Global Financing is a reportable segment that is measured as a
stand-alone entity.
In 2013, the Global Financing business remained focused on its
core competencies—providing IT financing to the company’s clients
and business partners. For the year, Global Financing delivered
external revenue of $2,022 million and total revenue of $4,304 mil-
lion, and expanded gross and pre-tax margins. Total pre-tax income
of $2,171 million increased 6.8 percent compared to 2012 and return
on equity was 40.6 percent.
In addition to the overall health of the economy and its impact
on corporate IT budgets, key drivers of Global Financing’s results
are interest rates and originations. Interest rates directly impact
Global Financing’s business by increasing or decreasing both
financing revenue and the associated borrowing costs. Originations,
which determine the asset base of Global Financing’s annuity-like
business, are impacted by IBM’s non-Global Financing sales and
services volumes and Global Financing’s participation rates. Par-
ticipation rates are the propensity of IBM’s clients to finance their
transactions through Global Financing in lieu of paying IBM up-front
cash or financing through a third party.
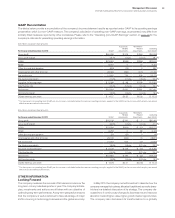
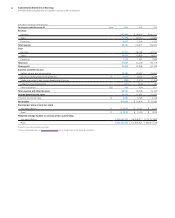
Results of Operations
($ in millions)
For the year ended December 31: 2013 2012 2011
External revenue $2,022 $2,013 $2,102
Internal revenue 2,282 2,060 2,092
Total revenue 4,304 4,073 4,195
Cost 1,417 1,400 1,467
Gross profit $2,888 $2,673 $2,728
Gross profit margin 67.1% 65.6%65.0%
Pre-tax income $2,171 $2,034 $2,011
After-tax income* $1,456 $1,362 $1,338
Return on equity* 40.6% 41.0%40.7%
* See page 75 for the details of the after-tax income and return on equity calculation.
Total revenue in 2013 increased $232 million versus 2012 as a result of:
• An increase in internal revenue of 10.8 percent driven by an
increase in used equipment sales revenue (up 20.0 percent
to $1,871 million), partially offset by a decrease in financing
revenue (down 17.9 percent to $411 million); and
• An increase in external revenue of 0.4 percent (3 percent
adjusted for currency) driven by an increase in financing
revenue (up 1.4 percent to $1,493 million), partially offset
by a decrease in used equipment sales revenue (down
2.3 percent to $528 million).
The decrease in internal financing revenue was primarily due to
lower asset yields and a decrease in remarketing lease revenue. The
increase in external financing revenue was due to a higher average
asset balance, partially offset by lower asset yields and a decrease
in remarketing lease revenue. Global Financing gross profit increased
8.0 percent compared to 2012 due to an increase in used equipment
sales gross profit, partially offset by a decrease in financing gross
profit. The gross profit margin increased 1.5 points due to an
increase in the used equipment sales margin, partially offset by a
shift in mix toward lower margin used equipment sales.
Total revenue in 2012 decreased $122 million versus 2011 as a
result of:
• A decline in external revenue of 4.2 percent (1 percent adjusted
for currency) driven by a decrease in financing revenue
(down 8.7 percent to $1,471 million), partially offset by
an increase in used equipment sales revenue (up 10.6
percent to $540 million); and
• A decline in internal revenue of 1.6 percent driven by a
decrease in financing revenue (down 11.3 percent to $500
million), partially offset by an increase in used equipment
sales revenue (up 2.0 percent to $1,559 million).
The decreases in external and internal financing revenue were due
to lower asset yields and a decrease in remarketing lease revenue.
Global Financing gross profit in 2012 decreased 2.0 percent
compared to 2011 due to a decrease in financing gross profit, par-
tially offset by an increase in used equipment sales gross profit. The
gross profit margin increased 0.6 points due to a higher financing
margin, partially offset by a shift in mix toward lower margin used
equipment sales and a lower used equipment sales margin.
Global Financing pre-tax income increased 6.8 percent in 2013
versus 2012, following an increase of 1.1 percent in 2012 versus 2011.
The increase in 2013 was driven by the increase in gross profit ($215
million), partially offset by increases in financing receivables provi-
sions ($60 million) and SG&A expenses ($20 million). The increase
in 2012 was driven by decreases in SG&A expenses ($61 million) and
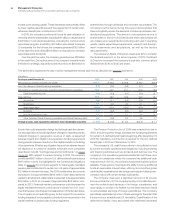
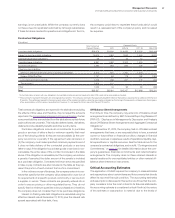
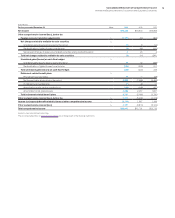
Employees and Related Workforce
Yr.-to-Yr. Percent Change
For the year ended December 31: 2013 2012 2011 2013-12 2012-11
IBM/wholly owned subsidiaries 431,212 434,246 433,362 (0.7)% 0.2%
Less-than-wholly owned subsidiaries 9,018 8,009 7,523 12.6 6.5
Complementary 23,555 24,740 25,500 (4.8)(3.0)