IBM 2013 Annual Report Download - page 36
Download and view the complete annual report
Please find page 36 of the 2013 IBM annual report below. You can navigate through the pages in the report by either clicking on the pages listed below, or by using the keyword search tool below to find specific information within the annual report.-
 1
1 -
2
-
3
-
4
-
5
-
6
-
7
-
8
-
9
-
10
-
11
-
12
-
13
-
14
-
15
-
16
-
17
-
18
-
19
-
20
-
21
-
22
-
23
-
24
-
25
-
 26
26 -
 27
27 -
 28
28 -
 29
29 -
 30
30 -
 31
31 -
 32
32 -
 33
33 -
 34
34 -
 35
35 -
 36
36 -
 37
37 -
 38
38 -
 39
39 -
 40
40 -
 41
41 -
 42
42 -
 43
43 -
 44
44 -
 45
45 -
 46
46 -
47
-
48
-
49
-
50
-
51
-
52
-
53
-
54
-
55
-
56
-
57
-
58
-
59
-
60
-
61
-
62
-
63
-
64
-
65
-
66
-
67
-
68
-
69
-
70
-
71
-
72
-
73
-
74
-
75
-
76
-
77
-
78
-
79
-
80
-
81
-
82
-
83
-
84
-
85
-
86
-
87
-
88
-
89
-
90
-
91
-
92
-
93
-
94
-
95
-
96
-
97
-
98
-
99
-
100
-
101
-
102
-
103
-
104
-
105
-
106
-
107
-
108
-
109
-
110
-
111
-
112
-
113
-
114
-
115
-
116
-
117
-
118
-
119
-
120
-
121
-
122
-
123
-
124
-
125
-
126
-
127
-
128
-
129
-
130
-
131
-
132
-
133
-
134
-
135
-
136
-
137
-
138
-
139
-
140
-
141
-
142
-
143
-
144
-
145
-
146
-
147
-
148
-
149
-
150
-
151
-
152
-
153
-
154
 |
 |

35
Management Discussion
International Business Machines Corporation and Subsidiary Companies
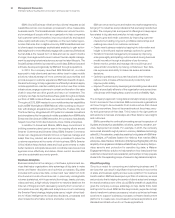
transformation governance, implemented a global operating model,
instrumented data, and connected employees to drive collaboration
across geographic and functional boundaries.
The Smarter Enterprise is enabled through application of
analytics, social, mobile and cloud tools, approaches and technolo-
gies. Analytics enable data-driven insights for faster, smarter
decision making. Social tools encourage peer-to-peer interactions,
and allow data to be shared within and outside IBM in a social way.
Mobile technology allows workers to work seamlessly from any-
where. Cloud infrastructure and services enable application delivery.
Collectively these enablers allow IBM to make decisions differently,
create value differently and deliver value differently, thereby improv-
ing employee engagement and client experience and ultimately
driving better business performance. The company primarily rein-
vests the benefits of its enterprise transformation initiatives in
remixing its spending profile and resources to its higher growth,
higher margin initiatives, in addition to improving profitability.
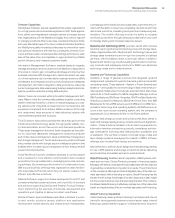
YEAR IN REVIEW
Segment Details
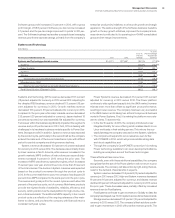
The following is an analysis of the 2013 versus 2012 reportable segment results. The table below presents each reportable segment’s external
revenue and gross margin results. Segment pre-tax income includes transactions between segments that are intended to reflect an arm’s-
length transfer price and excludes certain unallocated corporate items; see note T, “Segment Information,” on pages 141 to 146 for
additional information.
($ in millions)
For the year ended December 31: 2013 2012
Yr.-to-Yr.
Percent/
Margin
Change
Yr.-to-Yr.
Percent Change
Adjusted for
Currency
Revenue
Global Technology Services $38,551 $ 40,236 (4.2)% (1.4)%
Gross margin 38.1% 36.6% 1.5 pts.
Global Business Services 18,396 18,566 (0.9)% 2.6%
Gross margin 30.9% 30.0% 0.9 pts.
Software 25,932 25,448 1.9%2.9%
Gross margin 88.8% 88.7% 0.1 pts.
Systems and Technology 14,371 17,667 (18.7)% (17.9)%
Gross margin 35.6% 39.1% (3.5) pts.
Global Financing 2,022 2,013 0.4%2.8%
Gross margin 45.6% 46.5% (0.9 ) pts.
Other 478 577 (17.1)% (16.4)%
Gross margin (195.6)% (71.6)% (124.0) pts.
Total consolidated revenue $99,751 $104,507 (4.6)% (2.5)%
Total consolidated gross profit $48,505 $ 50,298 (3.6)%
Total consolidated gross margin 48.6% 48.1% 0.5 pts.
Non-operating adjustments
Amortization of acquired intangible assets 388 375 3.5%
Acquisition-related charges 51NM
Retirement-related costs/(income) 629 264 138.1%
Operating (non-GAAP) gross profit $49,527 $ 50,938 (2.8)%
Operating (non-GAAP) gross margin 49.7% 48.7% 0.9 pts.
NM—Not meaningful
Integrated Supply Chain
IBM has an extensive integrated supply chain, procuring materials and
services globally. In 2013, the company also managed approximately
$20 billion in procurement spending for its clients through the Global
Process Services organization. The supply, manufacturing and logistics
and sales transaction support operations are integrated in one operat-
ing unit that has optimized inventories over time. Simplifying and
streamlining internal processes has improved sales force productivity
and operational effectiveness and efficiency. Supply chain resiliency
enables IBM to reduce its risk during marketplace changes.
The company continues to derive business value from its own
globally integrated supply chain providing a strategic advantage for
the company to create value for clients. IBM leverages its supply
chain expertise for clients through its supply chain business trans-
formation outsourcing service to optimize and help operate clients’
end-to-end supply chain processes, from procurement to logistics.
The company has expanded its use of analytics to measure,
manage and fine tune its supply chain operations, which will help
reshape its operations and create value for clients.