IBM 2013 Annual Report Download - page 137
Download and view the complete annual report
Please find page 137 of the 2013 IBM annual report below. You can navigate through the pages in the report by either clicking on the pages listed below, or by using the keyword search tool below to find specific information within the annual report.-
 1
1 -
2
-
3
-
4
-
5
-
6
-
7
-
8
-
9
-
10
-
11
-
12
-
13
-
14
-
15
-
16
-
17
-
18
-
19
-
20
-
21
-
22
-
23
-
24
-
25
-
26
-
27
-
28
-
29
-
30
-
31
-
32
-
33
-
34
-
35
-
36
-
37
-
38
-
39
-
40
-
41
-
42
-
43
-
44
-
45
-
46
-
47
-
48
-
49
-
50
-
51
-
52
-
53
-
54
-
55
-
56
-
57
-
58
-
59
-
60
-
61
-
62
-
63
-
64
-
65
-
66
-
67
-
68
-
69
-
70
-
71
-
72
-
73
-
74
-
75
-
76
-
77
-
78
-
79
-
80
-
81
-
82
-
83
-
84
-
85
-
86
-
87
-
88
-
89
-
90
-
91
-
92
-
93
-
94
-
95
-
96
-
97
-
98
-
99
-
100
-
101
-
102
-
103
-
104
-
105
-
106
-
107
-
108
-
109
-
110
-
111
-
112
-
113
-
114
-
115
-
116
-
117
-
118
-
119
-
120
-
121
-
122
-
123
-
124
-
125
-
126
-
 127
127 -
 128
128 -
 129
129 -
 130
130 -
 131
131 -
 132
132 -
 133
133 -
 134
134 -
 135
135 -
 136
136 -
 137
137 -
 138
138 -
 139
139 -
 140
140 -
 141
141 -
 142
142 -
 143
143 -
 144
144 -
 145
145 -
 146
146 -
 147
147 -
148
-
149
-
150
-
151
-
152
-
153
-
154
 |
 |

Notes to Consolidated Financial Statements
International Business Machines Corporation and Subsidiary Companies
136
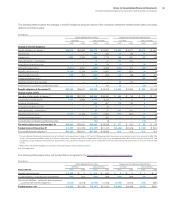
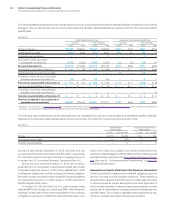
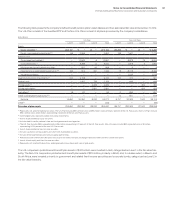
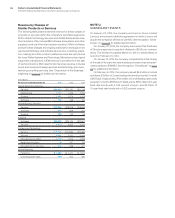
Defined Benefit Pension Plan Assets
The following table presents the company’s defined benefit pension plans’ asset classes and their associated fair value at December 31, 2013.
The U.S. Plan consists of the Qualified PPP and the Non-U.S. Plans consist of all plans sponsored by the company’s subsidiaries.
($ in millions)
U.S. Plan Non-U.S. Plans
Level 1 Level 2 Level 3 To t a l Level 1 Level 2 Level 3 To t a l
Equity
Equity securities (a) $15,929 $ — $ — $15,929 $6,489 $ — $ — $ 6,489
Equity commingled/mutual funds (b)(c) 216 2,593 — 2,809 132 8,325 — 8,457
Fixed income
Government and related (d) — 7,093 1 7,094 — 8,682 42 8,724
Corporate bonds (e) — 14,639 5 14,644 — 1,881 4 1,885
Mortgage and asset-backed securities — 691 19 709 — 8 — 8
Fixed income commingled/mutual funds (b)(f) 221 716 274 1,211 75 8,596 — 8,670
Insurance contracts — — — — — 1,196 — 1,196
Cash and short-term investments (g) 427 1,915 — 2,343 154 451 — 605
Hedge funds — 1,368 860 2,228 — 740 — 740
Private equity (h) — — 3,771 3,771 — — 410 410
Private real estate (h) — — 3,038 3,038 — — 655 655
Derivatives (i) 1 6 — 7 1 150 — 151
Other commingled/mutual funds (b)(j) — — — — 36 1,518 — 1,554
Subtotal 16,795 29,021 7,968 53,784 6,886 31,547 1,110 39,544
Other (k) — — — 170 — — — (80)
Fair value of plan assets $16,795 $29,021 $7,968 $53,954 $6,886 $31,547 $1,110
$39,464
(a) Represents U.S. and international securities. The U.S. Plan includes IBM common stock of $83 million, representing 0.2 percent of the U.S. Plan assets. Non-U.S. Plans include
IBM common stock of $31 million, representing 0.1 percent of the non-U.S. Plans assets.
(b) Commingled funds represent pooled institutional investments.
(c) Invests in predominantly equity securities.
(d) Includes debt issued by national, state and local governments and agencies.
(e) The U.S. Plan includes IBM corporate bonds of $9 million, representing 0.02 percent of the U.S. Plan assets. Non-U.S. plans include IBM corporate bonds of $1 million
representing 0.001 percent of the non-U.S. Plan assets.
(f) Invests in predominantly fixed-income securities.
(g) Includes cash and cash equivalents and short-term marketable securities.
(h) Includes limited partnerships and venture capital partnerships.
(i) Primarily includes interest rate derivatives and, to a lesser extent, forwards, exchange traded and other over-the-counter derivatives.
(j) Invests in both equity and fixed-income securities.
(k) Represents net unsettled transactions, relating primarily to purchases and sales of plan assets.
The U.S. nonpension postretirement benefit plan assets of $177 million were invested in cash, categorized as Level 1 in the fair value hier-
archy. The Non-U.S. nonpension postretirement benefit plan assets of $92 million, primarily in Brazil, and, to a lesser extent, in Mexico and
South Africa, were invested primarily in government and related fixed-income securities and corporate bonds, categorized as Level 2 in
the fair value hierarchy.