IBM 2013 Annual Report Download - page 124
Download and view the complete annual report
Please find page 124 of the 2013 IBM annual report below. You can navigate through the pages in the report by either clicking on the pages listed below, or by using the keyword search tool below to find specific information within the annual report.-
 1
1 -
2
-
3
-
4
-
5
-
6
-
7
-
8
-
9
-
10
-
11
-
12
-
13
-
14
-
15
-
16
-
17
-
18
-
19
-
20
-
21
-
22
-
23
-
24
-
25
-
26
-
27
-
28
-
29
-
30
-
31
-
32
-
33
-
34
-
35
-
36
-
37
-
38
-
39
-
40
-
41
-
42
-
43
-
44
-
45
-
46
-
47
-
48
-
49
-
50
-
51
-
52
-
53
-
54
-
55
-
56
-
57
-
58
-
59
-
60
-
61
-
62
-
63
-
64
-
65
-
66
-
67
-
68
-
69
-
70
-
71
-
72
-
73
-
74
-
75
-
76
-
77
-
78
-
79
-
80
-
81
-
82
-
83
-
84
-
85
-
86
-
87
-
88
-
89
-
90
-
91
-
92
-
93
-
94
-
95
-
96
-
97
-
98
-
99
-
100
-
101
-
102
-
103
-
104
-
105
-
106
-
107
-
108
-
109
-
110
-
111
-
112
-
113
-
 114
114 -
 115
115 -
 116
116 -
 117
117 -
 118
118 -
 119
119 -
 120
120 -
 121
121 -
 122
122 -
 123
123 -
 124
124 -
 125
125 -
 126
126 -
 127
127 -
 128
128 -
 129
129 -
 130
130 -
 131
131 -
 132
132 -
 133
133 -
 134
134 -
135
-
136
-
137
-
138
-
139
-
140
-
141
-
142
-
143
-
144
-
145
-
146
-
147
-
148
-
149
-
150
-
151
-
152
-
153
-
154
 |
 |

Notes to Consolidated Financial Statements
International Business Machines Corporation and Subsidiary Companies
123
and has been included in the 2013 reductions for tax positions of
prior years. In April 2011, the company received notification that the
appeal was denied. In June 2011, the company filed a lawsuit chal-
lenging this decision. The company filed its latest brief in December
2013. No final determination has been reached on this matter.
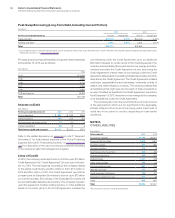
The liability at December 31, 2013 of $4,458 million can be
reduced by $556 million of offsetting tax benefits associated with
the correlative effects of potential transfer pricing adjustments, state
income taxes and timing adjustments. The net amount of $3,902
million, if recognized, would favorably affect the company’s effective
tax rate. The net amounts at December 31, 2012 and 2011 were
$5,099 million and $5,090 million, respectively.
Interest and penalties related to income tax liabilities are included
in income tax expense. During the year ended December 31, 2013,
the company recognized a $93 million benefit in interest expense
and penalties; in 2012, the company recognized $134 million in inter-
est expense and penalties, and in 2011, the company recognized
$129 million in interest expense and penalties. The company has $417
million for the payment of interest and penalties accrued at December
31, 2013, and had $533 million accrued at December 31, 2012.
Within the next 12 months, the company believes it is reasonably
possible that the total amount of unrecognized tax benefits associated
with certain positions may be reduced. The company expects that cer-
tain foreign and state issues may be concluded in the next 12 months.
The company estimates that the unrecognized tax benefits at December
31, 2013 could be reduced by approximately $101 million.
The company is subject to taxation in the U.S. and various state
and foreign jurisdictions. With respect to major U.S. state and foreign
taxing jurisdictions, the company is generally no longer subject to
tax examinations for years prior to 2008. The company is no longer
subject to income tax examination of its U.S. federal tax return for
years prior to 2011. The open years contain matters that could be
subject to differing interpretations of applicable tax laws and regula-
tions related to the amount and/or timing of income, deductions and
tax credits. Although the outcome of tax audits is always uncertain,
the company believes that adequate amounts of tax and interest
have been provided for any adjustments that are expected to result
for these years.
In the fourth quarter of 2013, the company received a draft tax
assessment notice for approximately $866 million from the Indian
Tax Authorities for 2009. The company believes it will prevail on
these matters and that this amount is not a meaningful indicator of
liability. At December 31, 2013, the company has recorded $433
million as prepaid income taxes in India. A significant portion of this
balance represents cash tax deposits paid over time to protect the
company’s right to appeal various income tax assessments made
by the Indian Tax Authorities.
The company has not provided deferred taxes on $52.3 billion
of undistributed earnings of non-U.S. subsidiaries at December 31,
2013, as it is the company’s policy to indefinitely reinvest these earn-
ings in non-U.S. operations. However, the company periodically
repatriates a portion of these earnings to the extent that it does not
incur an additional U.S. tax liability. Quantification of the deferred tax
liability, if any, associated with indefinitely reinvested earnings is not
practicable.
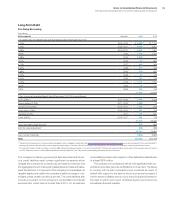
NOTE O.
RESEARCH, DEVELOPMENT AND ENGINEERING
RD&E expense was $6,226 million in 2013, $6,302 million in 2012
and $6,258 million in 2011.
The company incurred expense of $5,959 million, $6,034 million
and $5,990 million in 2013, 2012 and 2011, respectively, for scientific
research and the application of scientific advances to the develop-
ment of new and improved products and their uses, as well as
services and their application. Within these amounts, software-
related expense was $3,077 million, $3,078 million and $3,097 million
in 2013, 2012 and 2011, respectively.
Expense for product-related engineering was $267 million,
$268 million and $267 million in 2013, 2012 and 2011, respectively.
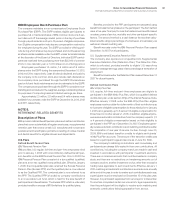
NOTE P.
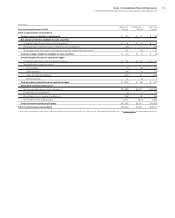
EARNINGS PER SHARE OF COMMON STOCK
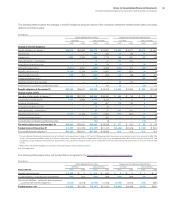
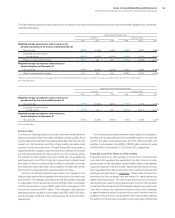
The following table presents the computation of basic and diluted earnings per share of common stock.
($ in millions except per share amounts)
For the year ended December 31: 2013 2012 2011
Weighted-average number of shares on which earnings per share calculations are based
Basic 1,094,486,604 1,142,508,521 1,196,951,006
Add—incremental shares under stock-based compensation plans 6,751,240 10,868,426 14,241,131
Add—incremental shares associated with contingently issuable shares 1,804,313 2,072,370 2,575,848
Assuming dilution 1,103,042,156 1,155,449,317 1,213,767,985
Net income on which basic earnings per share is calculated $16,483 $16,604 $15,855
Less—net income applicable to contingently issuable shares 11 0
Net income on which diluted earnings per share is calculated $16,483 $16,603 $15,855
Earnings/(loss) per share of common stock
Assuming dilution $ 14.94 $ 14.37 $ 13.06
Basic $ 15.06 $ 14.53 $ 13.25