IBM 2013 Annual Report Download - page 126
Download and view the complete annual report
Please find page 126 of the 2013 IBM annual report below. You can navigate through the pages in the report by either clicking on the pages listed below, or by using the keyword search tool below to find specific information within the annual report.-
 1
1 -
2
-
3
-
4
-
5
-
6
-
7
-
8
-
9
-
10
-
11
-
12
-
13
-
14
-
15
-
16
-
17
-
18
-
19
-
20
-
21
-
22
-
23
-
24
-
25
-
26
-
27
-
28
-
29
-
30
-
31
-
32
-
33
-
34
-
35
-
36
-
37
-
38
-
39
-
40
-
41
-
42
-
43
-
44
-
45
-
46
-
47
-
48
-
49
-
50
-
51
-
52
-
53
-
54
-
55
-
56
-
57
-
58
-
59
-
60
-
61
-
62
-
63
-
64
-
65
-
66
-
67
-
68
-
69
-
70
-
71
-
72
-
73
-
74
-
75
-
76
-
77
-
78
-
79
-
80
-
81
-
82
-
83
-
84
-
85
-
86
-
87
-
88
-
89
-
90
-
91
-
92
-
93
-
94
-
95
-
96
-
97
-
98
-
99
-
100
-
101
-
102
-
103
-
104
-
105
-
106
-
107
-
108
-
109
-
110
-
111
-
112
-
113
-
114
-
115
-
 116
116 -
 117
117 -
 118
118 -
 119
119 -
 120
120 -
 121
121 -
 122
122 -
 123
123 -
 124
124 -
 125
125 -
 126
126 -
 127
127 -
 128
128 -
 129
129 -
 130
130 -
 131
131 -
 132
132 -
 133
133 -
 134
134 -
 135
135 -
 136
136 -
137
-
138
-
139
-
140
-
141
-
142
-
143
-
144
-
145
-
146
-
147
-
148
-
149
-
150
-
151
-
152
-
153
-
154
 |
 |

Notes to Consolidated Financial Statements
International Business Machines Corporation and Subsidiary Companies
125
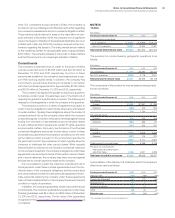
Stock Options
Stock options are awards which allow the employee to purchase
shares of the company’s stock at a fixed price. Stock options are
granted at an exercise price equal to the company’s average high
and low stock price on the date of grant. These awards, which
generally vest 25 percent per year, are fully vested four years from
the date of grant and have a contractual term of 10 years.
The company estimates the fair value of stock options at the date
of grant using the Black-Scholes valuation model. Key inputs and
assumptions used to estimate the fair value of stock options include
the grant price of the award, the expected option term, volatility of
the company’s stock, the risk-free rate and the company’s dividend
yield. Estimates of fair value are not intended to predict actual
future events or the value ultimately realized by employees who
receive equity awards, and subsequent events are not indicative
of the reasonableness of the original estimates of fair value made
by the company.
During the years ended December 31, 2013, 2012 and 2011, the
company did not grant stock options.
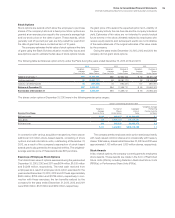
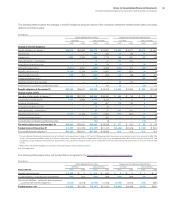
The following table summarizes option activity under the Plans during the years ended December 31, 2013, 2012 and 2011.
2013 2012 2011
Weighted-
Average
Exercise Price
Number of
Shares
Under Option
Weighted-
Average
Exercise Price
Number of
Shares
Under Option
Weighted-
Average
Exercise Price
Number of
Shares
Under Option
Balance at January 1 $94 11,389,721 $90 20,662,322 $ 94 39,197,728
Options exercised 90 (5,585,127) 86 (9,080,170)98 (18,144,309)
Options canceled/expired 86 (181,643) 75 (192,431)107 (391,097)
Balance at December 31 $97 5,622,951 $94 11,389,721 $ 90 20,662,322
Exercisable at December 31 $97 5,622,951 $94 11,389,721 $ 90 20,662,322
The shares under option at December 31, 2013 were in the following exercise price ranges:
Options Outstanding and Exercisable
Exercise Price Range
Weighted-
Average
Exercise Price
Number of
Shares
Under Option
Aggregate
Intrinsic
Value
Weighted-Average
Remaining
Contractual Life
(in Years)
$85 and under $ 82 468,427 $ 49,244,658 2.1
$86 – $105 98 4,908,689 440,012,196 1.1
$106 and over 106 245,835 20,055,475 0.2
$ 97 5,622,951 $509,312,330 1.1
In connection with various acquisition transactions, there was an
additional 0.6 million stock-based awards, consisting of stock
options and restricted stock units, outstanding at December 31,
2013, as a result of the company’s assumption of stock-based
awards previously granted by the acquired entities. The weighted-
average exercise price of these awards was $67 per share.
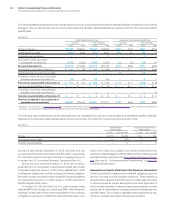
Exercises of Employee Stock Options
The total intrinsic value of options exercised during the years ended
December 31, 2013, 2012 and 2011 was $614 million, $1,005 million
and $1,269 million, respectively. The total cash received from
employees as a result of employee stock option exercises for the
years ended December 31, 2013, 2012 and 2011 was approximately
$505 million, $785 million and $1,786 million, respectively. In con-
nection with these exercises, the tax benefits realized by the
company for the years ended December 31, 2013, 2012 and 2011
were $199 million, $341 million and $412 million, respectively.
The company settles employee stock option exercises primarily
with newly issued common shares and, occasionally, with treasury
shares. Total treasury shares held at December 31, 2013 and 2012 were
approximately 1,153 million and 1,080 million shares, respectively.
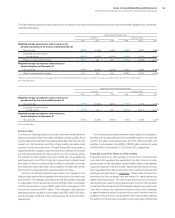
Stock Awards
In lieu of stock options, the company currently grants its employees
stock awards. These awards are made in the form of Restricted
Stock Units (RSUs), including Retention Restricted Stock Units
(RRSUs), or Performance Share Units (PSUs).