IBM 2013 Annual Report Download - page 59
Download and view the complete annual report
Please find page 59 of the 2013 IBM annual report below. You can navigate through the pages in the report by either clicking on the pages listed below, or by using the keyword search tool below to find specific information within the annual report.-
 1
1 -
2
-
3
-
4
-
5
-
6
-
7
-
8
-
9
-
10
-
11
-
12
-
13
-
14
-
15
-
16
-
17
-
18
-
19
-
20
-
21
-
22
-
23
-
24
-
25
-
26
-
27
-
28
-
29
-
30
-
31
-
32
-
33
-
34
-
35
-
36
-
37
-
38
-
39
-
40
-
41
-
42
-
43
-
44
-
45
-
46
-
47
-
48
-
 49
49 -
 50
50 -
 51
51 -
 52
52 -
 53
53 -
 54
54 -
 55
55 -
 56
56 -
 57
57 -
 58
58 -
 59
59 -
 60
60 -
 61
61 -
 62
62 -
 63
63 -
 64
64 -
 65
65 -
 66
66 -
 67
67 -
 68
68 -
 69
69 -
70
-
71
-
72
-
73
-
74
-
75
-
76
-
77
-
78
-
79
-
80
-
81
-
82
-
83
-
84
-
85
-
86
-
87
-
88
-
89
-
90
-
91
-
92
-
93
-
94
-
95
-
96
-
97
-
98
-
99
-
100
-
101
-
102
-
103
-
104
-
105
-
106
-
107
-
108
-
109
-
110
-
111
-
112
-
113
-
114
-
115
-
116
-
117
-
118
-
119
-
120
-
121
-
122
-
123
-
124
-
125
-
126
-
127
-
128
-
129
-
130
-
131
-
132
-
133
-
134
-
135
-
136
-
137
-
138
-
139
-
140
-
141
-
142
-
143
-
144
-
145
-
146
-
147
-
148
-
149
-
150
-
151
-
152
-
153
-
154
 |
 |

58 Management Discussion
International Business Machines Corporation and Subsidiary Companies
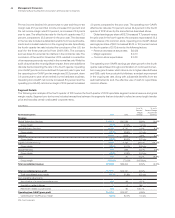
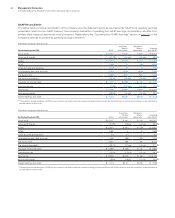
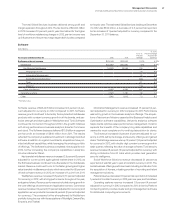
Other software revenue increased 7.0 percent (9 percent adjusted
for currency) driven by growth in software-related services.
($ in millions)
For the year ended December 31: 2012 2011
Yr.-to-Yr.
Percent/
Margin
Change
Software
External gross profit $22,569 $22,065 2.3%
External gross profit margin 88.7% 88.5% 0.2 pts.
Pre-tax income $10,810 $ 9,970 8.4%
Pre-tax margin 37.6% 35.3% 2.3 pts.
Software gross profit increased 2.3 percent to $22,569 million in 2012,
with a gross profit margin of 88.7 percent, up 0.2 points year to year.
Software pre-tax income of $10,810 million increased 8.4 percent and
the pre-tax margin improved 2.3 points to 37.6 percent. Normalized
for workforce rebalancing charges of $94 million and $6 million in the
third quarter of 2012 and 2011, respectively, software pre-tax income
was up 9.3 percent and the pre-tax margin expanded 2.6 points
versus the prior year. The Software business had another successful
year leveraging revenue growth and expense productivity which drove
significant margin expansion and profit growth.
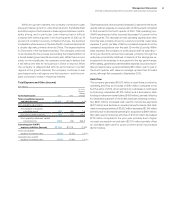
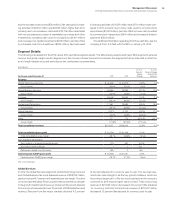
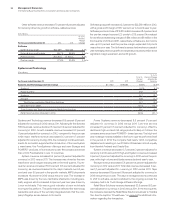
Systems and Technology
($ in millions)
For the year ended December 31: 2012 2011
Yr.-to-Yr.
Percent
Change
Yr.-to-Yr.
Percent Change
Adjusted for
Currency
Systems and Technology external revenue $17,667 $18,985 (6.9)% (5.9)%
System z 5.4% 6.3%
Power Systems (8.5) (7.4)
System x (3.7) (2.7)
Storage (5.8) (4.1)
Total Systems excluding Retail Store Solutions (3.7) (2.5)
Microelectronics OEM (14.4) (14.4)
Total Systems and Technology excluding Retail Store Solutions (5.1) (4.0)
Retail Store Solutions (Divested in 2012) (52.6) (51.7)
Systems and Technology revenue decreased 6.9 percent (6 percent
adjusted for currency) in 2012 versus 2011. Adjusting for the divested
RSS business, revenue declined 5.1 percent (4 percent adjusted for
currency) in 2012. Growth markets revenue increased 0.3 percent
(1 percent adjusted for currency) in 2012, compared to the prior year
while major markets revenue decreased 8.3 percent (7 percent
adjusted for currency). During 2012, the company’s continued invest-
ments for innovation supported the introduction of the new System
z mainframe, the PureSystems offerings and new Storage and
POWER7+ products. In its introductory year, the company sold more
than 2,300 PureSystems in over 70 countries.
System z revenue increased 5.4 percent (6 percent adjusted for
currency) in 2012 versus 2011. The increase was driven by the new
mainframe which began shipping late in the third quarter. Fourth-
quarter revenue increased 55.6 percent (56 percent adjusted for
currency), as revenue increased in the major markets over 50 per-
cent and over 65 percent in the growth markets. MIPS shipments
increased 19 percent in 2012 versus the prior year. The increase in
MIPS was driven by the new mainframe shipments, including spe-
cialty engines, which increased 44 percent year over year driven by
Linux workloads. This was a good indicator of new workloads
moving to this platform. The performance reflected the technology
leadership and value of the vertically integrated stack that the com
-
pany’s flagship server delivers to its clients.
Power Systems revenue decreased 8.5 percent (7 percent
adjusted for currency) in 2012 versus 2011. Low-end servers
increased 6 percent (7 percent adjusted for currency) offset by
declines in high-end and mid-range products. Early in October, the
company announced new POWER7+ based servers. The high-end
and midrange models available in the fourth quarter performed well
in the period. In 2012, the company had nearly 1,200 competitive
displacements resulting in over $1 billion of business; almost equally
from Hewlett Packard and Oracle/Sun.
System x revenue decreased 3.7 percent (3 percent adjusted for
currency) in 2012 versus 2011. High-end System x revenue increased
5 percent (6 percent adjusted for currency) in 2012 versus the prior
year, while high-volume and blade servers declined year to year.
Storage revenue decreased 5.8 percent (4 percent adjusted for
currency) in 2012 versus 2011. Total disk revenue decreased 3 per-
cent (1 percent adjusted for currency) in 2012 versus 2011. Tape
revenue decreased 16 percent (14 percent adjusted for currency) in
2012 versus the prior year. The value in storage solutions continued
to shift to software, as demonstrated by the ongoing success the
company had in its Tivoli storage software offerings.
Retail Store Solutions revenue decreased 52.6 percent (52 per-
cent adjusted for currency) in 2012 versus 2011. In the third quarter,
the company divested the Retail Store Solutions business to Toshiba
Tec. See the caption, “Divestitures,” on page 98 for additional infor-
mation regarding the transaction.