IBM 2013 Annual Report Download - page 62
Download and view the complete annual report
Please find page 62 of the 2013 IBM annual report below. You can navigate through the pages in the report by either clicking on the pages listed below, or by using the keyword search tool below to find specific information within the annual report.-
 1
1 -
2
-
3
-
4
-
5
-
6
-
7
-
8
-
9
-
10
-
11
-
12
-
13
-
14
-
15
-
16
-
17
-
18
-
19
-
20
-
21
-
22
-
23
-
24
-
25
-
26
-
27
-
28
-
29
-
30
-
31
-
32
-
33
-
34
-
35
-
36
-
37
-
38
-
39
-
40
-
41
-
42
-
43
-
44
-
45
-
46
-
47
-
48
-
49
-
50
-
51
-
 52
52 -
 53
53 -
 54
54 -
 55
55 -
 56
56 -
 57
57 -
 58
58 -
 59
59 -
 60
60 -
 61
61 -
 62
62 -
 63
63 -
 64
64 -
 65
65 -
 66
66 -
 67
67 -
 68
68 -
 69
69 -
 70
70 -
 71
71 -
 72
72 -
73
-
74
-
75
-
76
-
77
-
78
-
79
-
80
-
81
-
82
-
83
-
84
-
85
-
86
-
87
-
88
-
89
-
90
-
91
-
92
-
93
-
94
-
95
-
96
-
97
-
98
-
99
-
100
-
101
-
102
-
103
-
104
-
105
-
106
-
107
-
108
-
109
-
110
-
111
-
112
-
113
-
114
-
115
-
116
-
117
-
118
-
119
-
120
-
121
-
122
-
123
-
124
-
125
-
126
-
127
-
128
-
129
-
130
-
131
-
132
-
133
-
134
-
135
-
136
-
137
-
138
-
139
-
140
-
141
-
142
-
143
-
144
-
145
-
146
-
147
-
148
-
149
-
150
-
151
-
152
-
153
-
154
 |
 |

61
Management Discussion
International Business Machines Corporation and Subsidiary Companies
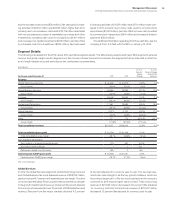
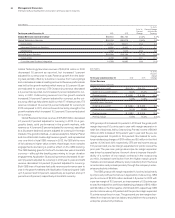
Other (Income) and Expense
($ in millions)
For the year ended December 31: 2012 2011
Yr.-to-Yr.
Percent
Change
Other (income) and expense
Foreign currency transaction
losses/(gains) $(240) $ 513 NM%
(Gains)/losses on
derivative instruments 72 (113)NM
Interest income (109) (136)(20.2)
Net (gains)/losses from securities
and investment assets (55)(227)(75.5)
Other (511)(58)NM
Total consolidated other
(income) and expense $(843)$ (20)NM%
Non-operating adjustment
Acquisition-related charges (13)(25)(46.0)
Operating (non-GAAP) other
(income) and expense $(857)$ (45)NM%
NM—Not meaningful
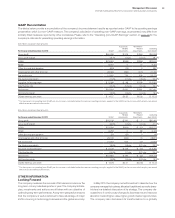
Other (income) and expense was income of $843 million and $20
million in 2012 and 2011, respectively. The increase in income of $823
million in 2012 was primarily driven by higher gains from foreign cur-
rency transactions ($753 million) due to rate volatility year to year,
and the gain associated with the divested RSS business ($446 mil-
lion) reflected in Other in the table above. These increases in income
were partially offset by increased losses on derivative instruments
($184 million) and lower gains from securities and investment asset
sales ($171 million). In 2011, the company had investment gains of
over $200 million, primarily from the sale of Lenovo shares.
Research, Development and Engineering
($ in millions)
For the year ended December 31: 2012 2011
Yr.-to-Yr.
Percent
Change
Total consolidated research,
development and engineering $6,302 $6,258 0.7%
Non-operating adjustment
Non-operating retirement-related
(costs)/income 20 88 (76.9)
Operating (non-GAAP) research,
development and engineering $6,322 $6,345 (0.4)%
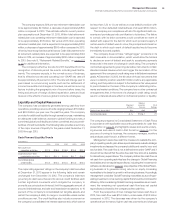
The company continued to invest in research and development,
focusing its investments on high-value, high-growth opportunities
and to extend its technology leadership. Total RD&E expense
increased 0.7 percent in 2012 versus 2011, primarily driven by acqui
-
sitions (3 points), partially offset by the effects of currency (2 points)
and lower base spending (1 point). Operating (non-GAAP) RD&E
expense decreased 0.4 percent in 2012 compared to the prior year
primarily driven by the effects of currency (2 points) and lower base
spending (2 points), partially offset by acquisitions (3 points). RD&E
investments represented 6.0 percent of revenue in 2012, compared
to 5.9 percent in 2011.
Intellectual Property and Custom Development Income
($ in millions)
For the year ended December 31: 2012 2011
Yr.-to-Yr.
Percent
Change
Sales and other transfers of
intellectual property $ 324 $ 309 4.7%
Licensing/royalty-based fees 251 211 19.0
Custom development income 500 588 (14.9)
To t a l $1,074 $1,108 (3.0)%
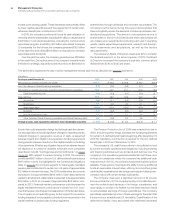
The timing and amount of sales and other transfers of IP may vary
significantly from period to period depending upon timing of dives-
titures, industry consolidation, economic conditions and the timing
of new patents and know-how development. There were no signifi-
cant individual IP transactions in 2012 or 2011.
Interest Expense
($ in millions)
For the year ended December 31: 2012 2011
Yr.-to-Yr.
Percent
Change
Interest expense
To t a l $459 $411 11.8%
The increase in interest expense in 2012 versus 2011 was primarily
driven by higher average debt levels, partially offset by lower average
interest rates. Interest expense is presented in cost of financing in
the Consolidated Statement of Earnings only if the related external
borrowings are to support the Global Financing external business.
See page 75 for additional information regarding Global Financing
debt and interest expense. Overall interest expense (excluding capi-
talized interest) for 2012 was $1,004 million, an increase of $40
million year to year.