IBM 2013 Annual Report Download - page 61
Download and view the complete annual report
Please find page 61 of the 2013 IBM annual report below. You can navigate through the pages in the report by either clicking on the pages listed below, or by using the keyword search tool below to find specific information within the annual report.-
 1
1 -
2
-
3
-
4
-
5
-
6
-
7
-
8
-
9
-
10
-
11
-
12
-
13
-
14
-
15
-
16
-
17
-
18
-
19
-
20
-
21
-
22
-
23
-
24
-
25
-
26
-
27
-
28
-
29
-
30
-
31
-
32
-
33
-
34
-
35
-
36
-
37
-
38
-
39
-
40
-
41
-
42
-
43
-
44
-
45
-
46
-
47
-
48
-
49
-
50
-
 51
51 -
 52
52 -
 53
53 -
 54
54 -
 55
55 -
 56
56 -
 57
57 -
 58
58 -
 59
59 -
 60
60 -
 61
61 -
 62
62 -
 63
63 -
 64
64 -
 65
65 -
 66
66 -
 67
67 -
 68
68 -
 69
69 -
 70
70 -
 71
71 -
72
-
73
-
74
-
75
-
76
-
77
-
78
-
79
-
80
-
81
-
82
-
83
-
84
-
85
-
86
-
87
-
88
-
89
-
90
-
91
-
92
-
93
-
94
-
95
-
96
-
97
-
98
-
99
-
100
-
101
-
102
-
103
-
104
-
105
-
106
-
107
-
108
-
109
-
110
-
111
-
112
-
113
-
114
-
115
-
116
-
117
-
118
-
119
-
120
-
121
-
122
-
123
-
124
-
125
-
126
-
127
-
128
-
129
-
130
-
131
-
132
-
133
-
134
-
135
-
136
-
137
-
138
-
139
-
140
-
141
-
142
-
143
-
144
-
145
-
146
-
147
-
148
-
149
-
150
-
151
-
152
-
153
-
154
 |
 |

60 Management Discussion
International Business Machines Corporation and Subsidiary Companies
Asia Pacific revenue increased 2.6 percent (3 percent adjusted
for currency) year over year. The Asia Pacific growth markets
increased 6.0 percent (7 percent adjusted for currency), with growth
led by China (17.9 percent as reported, 16 percent at constant cur-
rency) and India (decreased 0.9 percent as reported, increased 13
percent at constant currency). Japan revenue decreased 1.9 percent
(2 percent adjusted for currency) but improved sequentially through-
out the year at constant currency and returned to growth in the
fourth quarter of 2012.
OEM revenue of $2,239 million in 2012 decreased 18.5 percent
(18 percent adjusted for currency) compared to 2011, driven by the
Microelectronics OEM business.
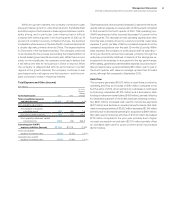
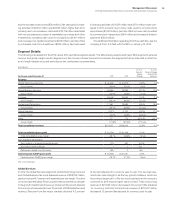
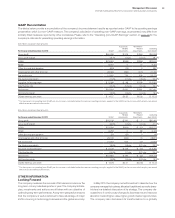
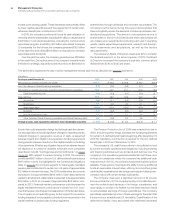
Total Expense and Other (Income)
($ in millions)
For the year ended December 31: 2012 2011
Yr.-to-Yr.
Percent/
Margin
Change
Total consolidated expense
and other (income) $28,396 $29,135 (2.5)%
Non-operating adjustments
Amortization of acquired
intangible assets (328) (289) 13.3
Acquisition-related charges (35) (45) (21.2)
Non-operating retirement-related
(costs)/income (274) 74 NM
Operating (non-GAAP)
expense and other (income) $27,760 $28,875 (3.9)%
Total consolidated
expense-to-revenue ratio 27.2% 27.3%(0.1) pts.
Operating (non-GAAP)
expense-to-revenue ratio 26.6%27.0%(0.4) pts.
NM—Not meaningful
Total expense and other (income) decreased 2.5 percent in 2012
versus 2011. Total operating (non-GAAP) expense and other (income)
decreased 3.9 percent versus the prior year. The key drivers of the
year-to-year change in total expense and other (income) were
approximately:
Total Operating
Consolidated (non-GAAP)
• Currency* (5) points (5) points
• Acquisitions** 3 points 2 points
• Base expense (0) points (2) points
* Reflects impacts of translation and hedging programs.
** Includes acquisitions completed in prior 12-month period, operating (non-GAAP) is
net of non-operating acquisition-related charges.
For additional information regarding total expense and other (income),
see the following analyses by category.
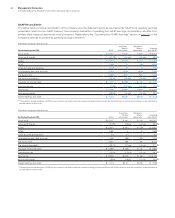
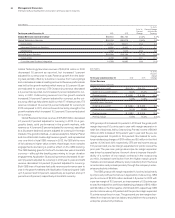
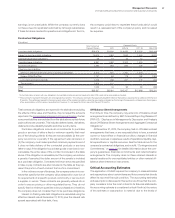
Selling, General and Administrative
($ in millions)
For the year ended December 31: 2012 2011
Yr.-to-Yr.
Percent
Change
Selling, general and
administrative expense
Selling, general and
administrative—other $19,589 $20,287 (3.4)%
Advertising and promotional expense 1,339 1,373 (2.5)
Workforce rebalancing charges 803 440 82.5
Retirement-related costs 945 603 56.7
Amortization of acquired
intangible assets 328 289 13.3
Stock-based compensation 498 514 (3.0)
Bad debt expense 50 88 (42.5)
Total consolidated selling, general
and administrative expense $23,553 $23,594 (0.2)%
Non-operating adjustments
Amortization of acquired
intangible assets (328)(289)13.3
Acquisition-related charges (22)(20)10.2
Non-operating retirement-related
(costs)/income (294)(13)NM
Operating (non-GAAP)
selling, general and
administrative expense $22,910 $23,272 (1.6)%
NM—Not meaningful
Total SG&A expense decreased 0.2 percent in 2012 versus 2011.
The decrease was primarily driven by the effects of currency (3
points), partially offset by acquisition-related spending (2 points),
while base spending was essentially flat.
Operating (non-GAAP) SG&A expense decreased 1.6 percent
primarily driven by the effects of currency (3 points) and lower base
spending (1 point), partially offset by acquisition-related spending (2
points). The increase in workforce rebalancing charges was due to
actions primarily focused on the company’s non-U.S. operations in
the third quarter of 2012. The increase in retirement-related costs
was primarily driven by the charge related to a court decision
regarding one of IBM UK’s defined benefit plans. As a result of the
ruling, the company recorded an additional retirement-related obli-
gation of $162 million in the third quarter of 2012. This charge was
not reflected in operating (non-GAAP) SG&A expense. See note M,
“Contingencies and Commitments,” on pages 119 to 121 for addi-
tional information. Bad debt expense decreased $37 million in 2012
versus 2011, as the company increased its provisions in 2011 reflect-
ing the European credit environment. The accounts receivable
provision coverage was 1.4 percent at December 31, 2012, a decrease
of 10 basis points from year-end 2011.