IBM 2013 Annual Report Download - page 64
Download and view the complete annual report
Please find page 64 of the 2013 IBM annual report below. You can navigate through the pages in the report by either clicking on the pages listed below, or by using the keyword search tool below to find specific information within the annual report.-
 1
1 -
2
-
3
-
4
-
5
-
6
-
7
-
8
-
9
-
10
-
11
-
12
-
13
-
14
-
15
-
16
-
17
-
18
-
19
-
20
-
21
-
22
-
23
-
24
-
25
-
26
-
27
-
28
-
29
-
30
-
31
-
32
-
33
-
34
-
35
-
36
-
37
-
38
-
39
-
40
-
41
-
42
-
43
-
44
-
45
-
46
-
47
-
48
-
49
-
50
-
51
-
52
-
53
-
 54
54 -
 55
55 -
 56
56 -
 57
57 -
 58
58 -
 59
59 -
 60
60 -
 61
61 -
 62
62 -
 63
63 -
 64
64 -
 65
65 -
 66
66 -
 67
67 -
 68
68 -
 69
69 -
 70
70 -
 71
71 -
 72
72 -
 73
73 -
 74
74 -
75
-
76
-
77
-
78
-
79
-
80
-
81
-
82
-
83
-
84
-
85
-
86
-
87
-
88
-
89
-
90
-
91
-
92
-
93
-
94
-
95
-
96
-
97
-
98
-
99
-
100
-
101
-
102
-
103
-
104
-
105
-
106
-
107
-
108
-
109
-
110
-
111
-
112
-
113
-
114
-
115
-
116
-
117
-
118
-
119
-
120
-
121
-
122
-
123
-
124
-
125
-
126
-
127
-
128
-
129
-
130
-
131
-
132
-
133
-
134
-
135
-
136
-
137
-
138
-
139
-
140
-
141
-
142
-
143
-
144
-
145
-
146
-
147
-
148
-
149
-
150
-
151
-
152
-
153
-
154
 |
 |

63
Management Discussion
International Business Machines Corporation and Subsidiary Companies
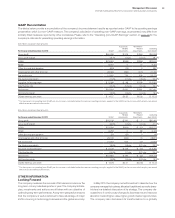
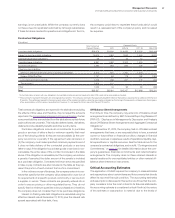
GAAP Reconciliation
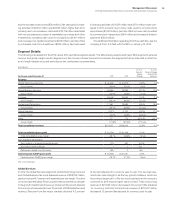
The tables below provide a reconciliation of the company’s income statement results as reported under GAAP to its operating earnings
presentation which is a non-GAAP measure. The company’s calculation of operating (non-GAAP) earnings, as presented, may differ from
similarly titled measures reported by other companies. Please refer to the “Operating (non-GAAP) Earnings” section on page 26 for the
company’s rationale for presenting operating earnings information.
($ in millions except per share amounts)
For the year ended December 31, 2012: GAAP
Acquisition-
Related
Adjustments
Retirement-
Related
Adjustments
Operating
(non-GAAP)
Gross profit $50,298 $ 376 $ 264 $50,938
Gross profit margin 48.1% 0.4 pts. 0.3 pts. 48.7%
SG&A $23,553 $(349) $(294) $22,910
RD&E 6,302 0 20 6,322
Other (income) and expense (843) (13) 0 (857)
Total expense and other (income) 28,396 (363) (274)27,760
Pre-tax income 21,902 739 538 23,179
Pre-tax income margin 21.0% 0.7 pts. 0.5 pts. 22.2%
Provision for income taxes* $ 5,298 $ 98 $ 156 $ 5,552
Effective tax rate 24.2% (0.4) pts. 0.1 pts. 24.0%
Net income $16,604 $ 641 $ 381 $17,627
Net income margin 15.9% 0.6 pts. 0.4 pts. 16.9%
Diluted earnings per share $ 14.37 $0.55 $0.33 $ 15.25
*
The tax impact on operating (non-GAAP) pre-tax income is calculated under the same accounting principles applied to the GAAP pre-tax income which employs an annual
effective tax rate method to the results.
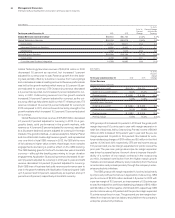
($ in millions except per share amounts)
For the year ended December 31, 2011: GAAP
Acquisition-
Related
Adjustments
Retirement-
Related
Adjustments
Operating
(non-GAAP)
Gross profit $50,138 $ 341 $ 2 $50,481
Gross profit margin 46.9% 0.3 pts. 0.0 pts. 47.2%
SG&A $23,594 $(309) $ (13) $23,272
RD&E 6,258 0 88 6,345
Other (income) and expense (20) (25) 0 (45)
Total expense and other (income) 29,135 (334) 74 28,875
Pre-tax income 21,003 675 (72)21,605
Pre-tax income margin 19.6% 0.6 pts. (0.1) pts. 20.2%
Provision for income taxes* $ 5,148 $ 179 $ (40)$ 5,287
Effective tax rate 24.5% 0.1 pts. (0.1) pts. 24.5%
Net income $15,855 $ 495 $ (32)$16,318
Net income margin 14.8% 0.5 pts. (0.0) pts. 15.3%
Diluted earnings per share $ 13.06 $0.41 $(0.03)$ 13.44
*
The tax impact on operating (non-GAAP) pre-tax income is calculated under the same accounting principles applied to the GAAP pre-tax income which employs an annual
effective tax rate method to the results.
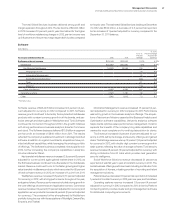
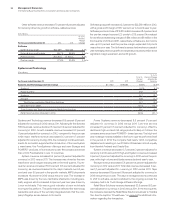
OTHER INFORMATION
Looking Forward
The company measures the success of its business model over the
long term, not any individual quarter or year. The company’s strate-
gies, investments and actions are all taken with an objective of
optimizing long-term performance. A long-term perspective ensures
that the company is well-positioned to take advantage of major
shifts occurring in technology, business and the global economy.
In May 2010, the company met with investors to describe how the
company manages its business, allocates it capital and serves its share-
holders in a detailed discussion of its strategy. The company dis-
cussed how it continuously changes its business mix and resource
allocation toward higher value, higher growth market opportunities.
The company also discussed its transformation to a globally