IBM 2013 Annual Report Download - page 55
Download and view the complete annual report
Please find page 55 of the 2013 IBM annual report below. You can navigate through the pages in the report by either clicking on the pages listed below, or by using the keyword search tool below to find specific information within the annual report.-
 1
1 -
2
-
3
-
4
-
5
-
6
-
7
-
8
-
9
-
10
-
11
-
12
-
13
-
14
-
15
-
16
-
17
-
18
-
19
-
20
-
21
-
22
-
23
-
24
-
25
-
26
-
27
-
28
-
29
-
30
-
31
-
32
-
33
-
34
-
35
-
36
-
37
-
38
-
39
-
40
-
41
-
42
-
43
-
44
-
 45
45 -
 46
46 -
 47
47 -
 48
48 -
 49
49 -
 50
50 -
 51
51 -
 52
52 -
 53
53 -
 54
54 -
 55
55 -
 56
56 -
 57
57 -
 58
58 -
 59
59 -
 60
60 -
 61
61 -
 62
62 -
 63
63 -
 64
64 -
 65
65 -
66
-
67
-
68
-
69
-
70
-
71
-
72
-
73
-
74
-
75
-
76
-
77
-
78
-
79
-
80
-
81
-
82
-
83
-
84
-
85
-
86
-
87
-
88
-
89
-
90
-
91
-
92
-
93
-
94
-
95
-
96
-
97
-
98
-
99
-
100
-
101
-
102
-
103
-
104
-
105
-
106
-
107
-
108
-
109
-
110
-
111
-
112
-
113
-
114
-
115
-
116
-
117
-
118
-
119
-
120
-
121
-
122
-
123
-
124
-
125
-
126
-
127
-
128
-
129
-
130
-
131
-
132
-
133
-
134
-
135
-
136
-
137
-
138
-
139
-
140
-
141
-
142
-
143
-
144
-
145
-
146
-
147
-
148
-
149
-
150
-
151
-
152
-
153
-
154
 |
 |

54 Management Discussion
International Business Machines Corporation and Subsidiary Companies
an increase of 8 points since 2006. The company has been suc-
cessful in capturing the opportunity in these faster growing markets.
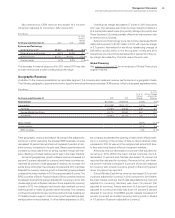
The company’s business analytics initiative continued to expand.
The company made significant strides and expanded its leadership
in a number of strategic areas including Risk Management, Price
and Promotion Optimization and Sales Performance Management.
The value proposition in business analytics uniquely leverages the
integration between the software portfolio and the GBS consulting
expertise. In 2012, business analytics revenue increased 13 percent
compared to the prior year, led by the GBS consulting practice.
Within cloud computing, the company’s SmartCloud portfolio
addresses the full scope of enterprise client requirements. In 2012,
the company continued to see strong demand for the foundational
offerings in hardware and software that help clients build and run
their private clouds, as well as for cloud-based solutions, like the
company’s Software as a Service (SaaS) offerings. With strong
global growth, cloud revenue for 2012 increased 80 percent com-
pared to the prior year. The Smarter Planet growth initiative
expanded significantly in the past year—measured in terms of offer-
ings, markets, clients and revenue performance. Clients are
leveraging the company’s growing capabilities in areas like: Smarter
Commerce, Social Business and Smarter Cities, and in next gen-
eration systems, like Watson, which are helping clients with their
complex challenges. For the year, Smarter Planet solutions gener-
ated revenue growth of over 25 percent versus the prior year.
Overall, within the offerings in business analytics, cloud and
Smarter Planet, approximately half of the revenue was software.
Therefore, as these offerings become a larger percentage of total
revenue, they are driving the higher quality revenue stream and
improved mix and margins.
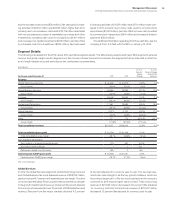
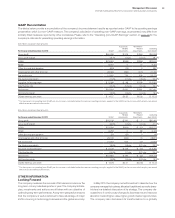
The consolidated gross profit margin increased 1.2 points versus
2011 to 48.1 percent. This was the ninth consecutive year of improve-
ment in the gross profit margin. The operating (non-GAAP) gross
margin of 48.7 percent increased 1.5 points compared to the prior
year. The increase in gross margin in 2012 was driven by margin
improvements in Software and both Global Services segments, and
an improved revenue mix driven by Software.
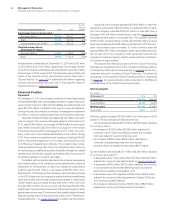
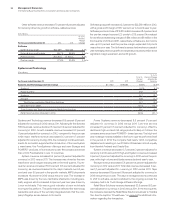
Total expense and other (income) decreased 2.5 percent in 2012
versus the prior year. Total operating (non-GAAP) expense and other
(income) decreased 3.9 percent compared to the prior year. The
year-to-year drivers were approximately:
Total Operating
Consolidated (non-GAAP)
• Currency* (5) points (5) points
• Acquisitions** 3 points 2 points
• Base expense (0) points (2) points
* Reflects impacts of translation and hedging programs.
** Includes acquisitions completed in prior 12-month period, operating (non-GAAP) is
net of non-operating acquisition-related charges.
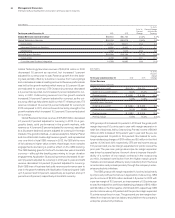
Pre-tax income grew 4.3 percent and the pre-tax margin was 21.0
percent, an increase of 1.3 points versus 2011. Net income increased
4.7 percent and the net income margin was 15.9 percent, an increase
of 1.1 points versus 2011. The effective tax rate for 2012 was 24.2
percent compared with 24.5 percent in the prior year. Operating
(non-GAAP) pre-tax income grew 7.3 percent and the operating
(non-GAAP) pre-tax margin was 22.2 percent, an increase of 2.0
points versus the prior year. Operating (non-GAAP) net income
increased 8.0 percent and the operating (non-GAAP) net income
margin of 16.9 percent increased 1.6 points versus the prior year.
The operating (non-GAAP) effective tax rate was 24.0 percent
versus 24.5 percent in 2011.
Diluted earnings per share improved 10.0 percent year to year
reflecting the growth in net income and the benefits of the common
stock repurchase program. In 2012, the company repurchased
approximately 61 million shares of its common stock. Diluted earn-
ings per share of $14.37 increased $1.31 from the prior year. Operating
(non-GAAP) diluted earnings per share of $15.25 increased $1.81
versus 2011 driven by the following factors:
• Revenue decrease at actual rates $(0.30)
• Margin expansion $ 1.38
• Common stock repurchases $ 0.73
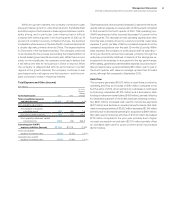
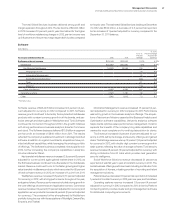
At December 31, 2012, the company’s balance sheet and liquidity
positions were strong and well positioned to support the company’s
objectives. Cash and marketable securities at year end was $11,128
million. Key drivers in the balance sheet and total cash flows are
highlighted below.
Total assets increased $2,780 million ($3,242 million adjusted for
currency) from December 31, 2011 driven by:
• Increases in total receivables ($3,053 million), goodwill
($3,034 million), marketable securities ($717 million) and
intangible assets ($395 million); partially offset by
• Decreases in prepaid pension assets ($1,899 million), cash
and cash equivalents ($1,511 million) and prepaid expenses
and other current assets ($1,224 million).
Total liabilities increased $4,032 million ($4,511 million adjusted for
currency) from December 31, 2011 driven by:
• Increased retirement and nonpension postretirement benefit
obligations ($2,044 million), total debt ($1,949 million), taxes
($1,635 million) and total deferred income ($399 million);
partially offset by
• Decreases in other liabilities ($1,389 million) and accounts
payable ($565 million).
Total equity of $18,984 million decreased $1,252 million from
December 31, 2011 as a result of:
• Increased treasury stock ($12,168 million) driven by share
repurchases and increased losses in accumulated other
comprehensive income/(loss) of ($3,874 million) driven
by pension remeasurements; partially offset by
• Higher retained earnings ($12,783 million) and common stock
($1,980 million).
The company generated $19,586 million in cash flow provided by
operating activities, a decrease of $260 million when compared to
2011, primarily driven by a decrease in cash due to receivables ($1,290
million) and an increased use of cash for accounts payable ($675
million), partially offset by a decrease in net taxes paid ($999 million)