IBM 2013 Annual Report Download - page 29
Download and view the complete annual report
Please find page 29 of the 2013 IBM annual report below. You can navigate through the pages in the report by either clicking on the pages listed below, or by using the keyword search tool below to find specific information within the annual report.
28 Management Discussion
International Business Machines Corporation and Subsidiary Companies
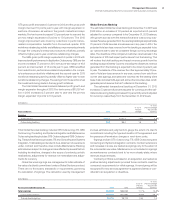
Total expense and other (income) increased 2.1 percent in 2013
versus the prior year. Total operating (non-GAAP) expense and
other (income) increased 1.4 percent compared to the prior year.
The year-to-year drivers were approximately:
Total Operating
Consolidated (non-GAAP)
• Currency* (1) point (1) point
• Acquisitions** 2 po i nts 2 points
• Base expense 1 point 1 point
* Reflects impacts of translation and hedging programs.
** Includes acquisitions completed in prior 12-month period.
There were several items that had an impact on total expense and
other (income) year to year. Workforce rebalancing charges for 2013
were $1,064 million compared to $803 million in the prior year. Bad
debt expense increased $106 million year to year driven by higher
specific account reserves. In addition, in 2012, the company recorded
a gain of $446 million related to the divestiture of the Retail Store
Solutions (RSS) business, and also recorded a charge of $162 million
related to a court ruling in the UK regarding one of IBM’s UK defined
benefit pension plans. This charge was not included in the compa-
ny’s operating (non-GAAP) expense and other (income). Also, the
company has a performance-based compensation structure. As a
result of certain parts of the business not performing as expected,
performance-related compensation in 2013 across both cost and
expense was down $777 million compared to the prior year.
Pre-tax income decreased 10.9 percent and the pre-tax margin
was 19.6 percent, a decrease of 1.4 points versus 2012. Net income
decreased 0.7 percent and the net income margin was 16.5 percent,
an increase of 0.6 points versus 2012. The effective tax rate for 2013
was 15.6 percent, a decrease of 8.6 points versus the prior year
driven by an improvement in the ongoing tax rate and discrete tax
items, including audit settlements. Operating (non-GAAP) pre-tax
income decreased 7.7 percent and the operating (non-GAAP) pre-
tax margin was 21.4 percent, a decrease of 0.7 points versus the
prior year. Operating (non-GAAP) net income increased 1.9 percent
and the operating (non-GAAP) net income margin of 18.0 percent
increased 1.1 points versus the prior year. The operating (non-GAAP)
effective tax rate was 16.0 percent versus 24.0 percent in 2012 driven
by the same factors described above.
Diluted earnings per share improved 4.0 percent year to year reflect-
ing the benefits of the common stock repurchase program. In 2013,
the company repurchased approximately 73 million shares of its
common stock. Diluted earnings per share of $14.94 increased $0.57
from the prior year. Operating (non-GAAP) diluted earnings per share
of $16.28 increased $1.03 versus 2012 driven by the following factors:
• Revenue decrease at actual rates $ (0.69)
• Margin expansion $ 0.98
• Common stock repurchases $ 0.74
At December 31, 2013, the company’s balance sheet and liquidity
positions remained strong and were well positioned to support the
business over the long term. Cash and marketable securities at
year end was $11,066 million, consistent with the year-end 2012
balance. Key drivers in the balance sheet and total cash flows are:
Total assets increased $7,010 million ($9,337 million adjusted for
currency) from December 31, 2012 driven by:
• Increases in prepaid pension assets ($4,607 million), goodwill
($1,937 million) and total receivables ($1,202 million); partially
offset by
• Decreases in deferred taxes ($687 million).
Total liabilities increased $3,065 million ($4,494 million adjusted for
currency) from December 31, 2012 driven by:
• Increased total debt ($6,449 million) and increases
in deferred tax liabilities ($1,336 million); partially offset by
• Decreased retirement and nonpension postretirement
benefit obligations ($4,176 million) and decreases in
compensation and benefits ($853 million).
Total equity of $22,929 million increased $3,945 million from
December 31, 2012 as a result of:
• Higher retained earnings ($12,401 million), decreased losses
in accumulated other comprehensive income/(loss) of
$4,157 million and increased common stock ($1,484 million);
partially offset by
• Increased treasury stock ($14,110 million) driven by share
repurchases.
The company generated $17,485 million in cash flow provided by
operating activities, a decrease of $2,102 million when compared to
2012, primarily driven by operational performance and a net increase
in the use of cash for taxes of $2,200 million primarily driven by an
increase in cash tax payments. Net cash used in investing activities
of $7,326 million was $1,679 million lower than 2012, primarily due
to a decrease in cash used associated with the net purchases and
sales of marketable securities and other investments ($1,232 million)
and decreased net capital investments ($539 million). Net cash used
in financing activities of $9,883 million was $2,094 million lower
compared to 2012, primarily due to increased proceeds from net
debt ($4,708 million), partially offset by increased cash used for
gross common stock repurchases ($1,865 million).
In January 2014, the company disclosed that it is expecting GAAP
earnings of at least $17.00 and operating (non-GAAP) earnings of at
least $18.00 per diluted share for the full-year 2014. The company
also stated that in the first quarter of 2014 it expects to close the initial
phase of the sale of its customer care business to SYNNEX and that
it also expects to take the majority of its workforce rebalancing
actions for the year in the same period. As a result, the company
expects its first-quarter 2014 GAAP and operating (non-GAAP) earn-
ings per share to be approximately 14 percent of the full year
expectation, reflecting about half of the divestiture gain, the workforce
rebalancing charges and continued impacts from currency.
For additional information and details, see the “Year in Review”
section on pages 35 through 52.
DESCRIPTION OF BUSINESS
Please refer to IBM’s Annual Report on Form 10-K filed with
the SEC on February 25, 2014 for a more detailed version of this
Des cription of Business, especially Item 1A. entitled “Risk Factors.”


