Delta Airlines 2009 Annual Report Download - page 97
Download and view the complete annual report
Please find page 97 of the 2009 Delta Airlines annual report below. You can navigate through the pages in the report by either clicking on the pages listed below, or by using the keyword search tool below to find specific information within the annual report.-
 1
1 -
2
-
3
-
4
-
5
-
6
-
7
-
8
-
9
-
10
-
11
-
12
-
13
-
14
-
15
-
16
-
17
-
18
-
19
-
20
-
21
-
22
-
23
-
24
-
25
-
26
-
27
-
28
-
29
-
30
-
31
-
32
-
33
-
34
-
35
-
36
-
37
-
38
-
39
-
40
-
41
-
42
-
43
-
44
-
45
-
46
-
47
-
48
-
49
-
50
-
51
-
52
-
53
-
54
-
55
-
56
-
57
-
58
-
59
-
60
-
61
-
62
-
63
-
64
-
65
-
66
-
67
-
68
-
69
-
70
-
71
-
72
-
73
-
74
-
75
-
76
-
77
-
78
-
79
-
80
-
81
-
82
-
83
-
84
-
85
-
86
-
 87
87 -
 88
88 -
 89
89 -
 90
90 -
 91
91 -
 92
92 -
 93
93 -
 94
94 -
 95
95 -
 96
96 -
 97
97 -
 98
98 -
 99
99 -
 100
100 -
 101
101 -
 102
102 -
 103
103 -
 104
104 -
 105
105 -
 106
106 -
 107
107 -
108
-
109
-
110
-
111
-
112
-
113
-
114
-
115
-
116
-
117
-
118
-
119
-
120
-
121
-
122
-
123
-
124
-
125
-
126
-
127
-
128
-
129
-
130
-
131
-
132
-
133
-
134
-
135
-
136
-
137
-
138
-
139
-
140
-
141
-
142
-
143
-
144
-
145
-
146
-
147
-
148
-
149
-
150
-
151
-
152
-
153
-
154
-
155
-
156
-
157
-
158
-
159
-
160
-
161
-
162
-
163
-
164
-
165
-
166
-
167
-
168
-
169
-
170
-
171
-
172
-
173
-
174
-
175
-
176
-
177
-
178
-
179
 |
 |
Table of Contents
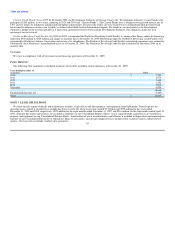
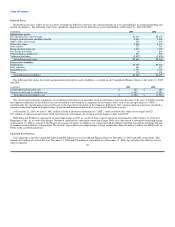
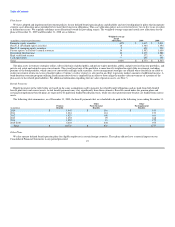
Deferred Taxes
Deferred income taxes reflect the net tax effect of temporary differences between the carrying amounts of assets and liabilities for financial reporting and
income tax purposes. The following table shows significant components of our deferred tax assets and liabilities at December 31, 2009 and 2008:
(in millions) 2009 2008
Deferred tax assets:
Net operating loss carryforwards $6,419 $5,450
Pension, postretirement and other benefits 4,661 4,491
AMT credit carryforward 452 505
Deferred revenue 2,282 2,339
Rent expense 272 291
Reorganization items, net 1,033 1,375
Fuel hedge derivatives 30 663
Other temporary differences 413 565
Valuation allowance (9,897) (9,830)
Total deferred tax assets $5,665 $5,849
Deferred tax liabilities:
Depreciation $4,858 $4,856
Debt valuation 431 627
Intangible assets 1,757 1,795
Other 179 151
Total deferred tax liabilities $7,225 $7,429
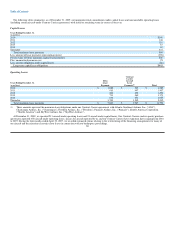
The following table shows the current and noncurrent deferred tax assets (liabilities), recorded on our Consolidated Balance Sheets at December 31, 2009
and 2008:
(in millions) 2009 2008
Current deferred tax assets, net $ 107 $ 401
Noncurrent deferred tax liabilities, net (1,667) (1,981)
Total deferred tax liabilities, net $ (1,560) $ (1,580)
The current and noncurrent components of our deferred tax balances are generally based on the balance sheet classification of the asset or liability creating
the temporary difference. If the deferred tax asset or liability is not based on a component of our balance sheet, such as our net operating loss ("NOL")
carryforwards, the classification is presented based on the expected reversal date of the temporary difference. Our valuation allowance has been classified as
current or noncurrent based on the percentages of current and noncurrent deferred tax assets to total deferred tax assets.
At December 31, 2009, we had (1) $452 million of federal alternative minimum tax ("AMT") credit carryforwards, which do not expire and (2)
$17.3 billion of federal and state pretax NOL carryforwards, substantially all of which will not begin to expire until 2022.
Both Delta and Northwest experienced an ownership change in 2007 as a result of their respective plans of reorganization under Chapter 11 of the U.S.
Bankruptcy Code. As a result of the Merger, Northwest experienced a subsequent ownership change. Delta also experienced a subsequent ownership change
on December 17, 2008 as a result of the Merger, the issuance of equity to employees in connection with the Merger and other transactions involving the sale
of common stock within the testing period. We currently expect these ownership changes will not significantly limit our ability to utilize our AMT credit or
NOLs in the carryforward period.
Uncertain Tax Positions
Unrecognized tax benefits totaled $66 million and $29 million on our Consolidated Balance Sheets at December 31, 2009 and 2008, respectively. This
includes $47 million of tax benefits as of December 31, 2009 and $10 million of tax benefits as of December 31, 2008, that will affect the effective tax rate
when recognized. 92