Delta Airlines 2009 Annual Report Download - page 81
Download and view the complete annual report
Please find page 81 of the 2009 Delta Airlines annual report below. You can navigate through the pages in the report by either clicking on the pages listed below, or by using the keyword search tool below to find specific information within the annual report.-
 1
1 -
2
-
3
-
4
-
5
-
6
-
7
-
8
-
9
-
10
-
11
-
12
-
13
-
14
-
15
-
16
-
17
-
18
-
19
-
20
-
21
-
22
-
23
-
24
-
25
-
26
-
27
-
28
-
29
-
30
-
31
-
32
-
33
-
34
-
35
-
36
-
37
-
38
-
39
-
40
-
41
-
42
-
43
-
44
-
45
-
46
-
47
-
48
-
49
-
50
-
51
-
52
-
53
-
54
-
55
-
56
-
57
-
58
-
59
-
60
-
61
-
62
-
63
-
64
-
65
-
66
-
67
-
68
-
69
-
70
-
 71
71 -
 72
72 -
 73
73 -
 74
74 -
 75
75 -
 76
76 -
 77
77 -
 78
78 -
 79
79 -
 80
80 -
 81
81 -
 82
82 -
 83
83 -
 84
84 -
 85
85 -
 86
86 -
 87
87 -
 88
88 -
 89
89 -
 90
90 -
 91
91 -
92
-
93
-
94
-
95
-
96
-
97
-
98
-
99
-
100
-
101
-
102
-
103
-
104
-
105
-
106
-
107
-
108
-
109
-
110
-
111
-
112
-
113
-
114
-
115
-
116
-
117
-
118
-
119
-
120
-
121
-
122
-
123
-
124
-
125
-
126
-
127
-
128
-
129
-
130
-
131
-
132
-
133
-
134
-
135
-
136
-
137
-
138
-
139
-
140
-
141
-
142
-
143
-
144
-
145
-
146
-
147
-
148
-
149
-
150
-
151
-
152
-
153
-
154
-
155
-
156
-
157
-
158
-
159
-
160
-
161
-
162
-
163
-
164
-
165
-
166
-
167
-
168
-
169
-
170
-
171
-
172
-
173
-
174
-
175
-
176
-
177
-
178
-
179
 |
 |
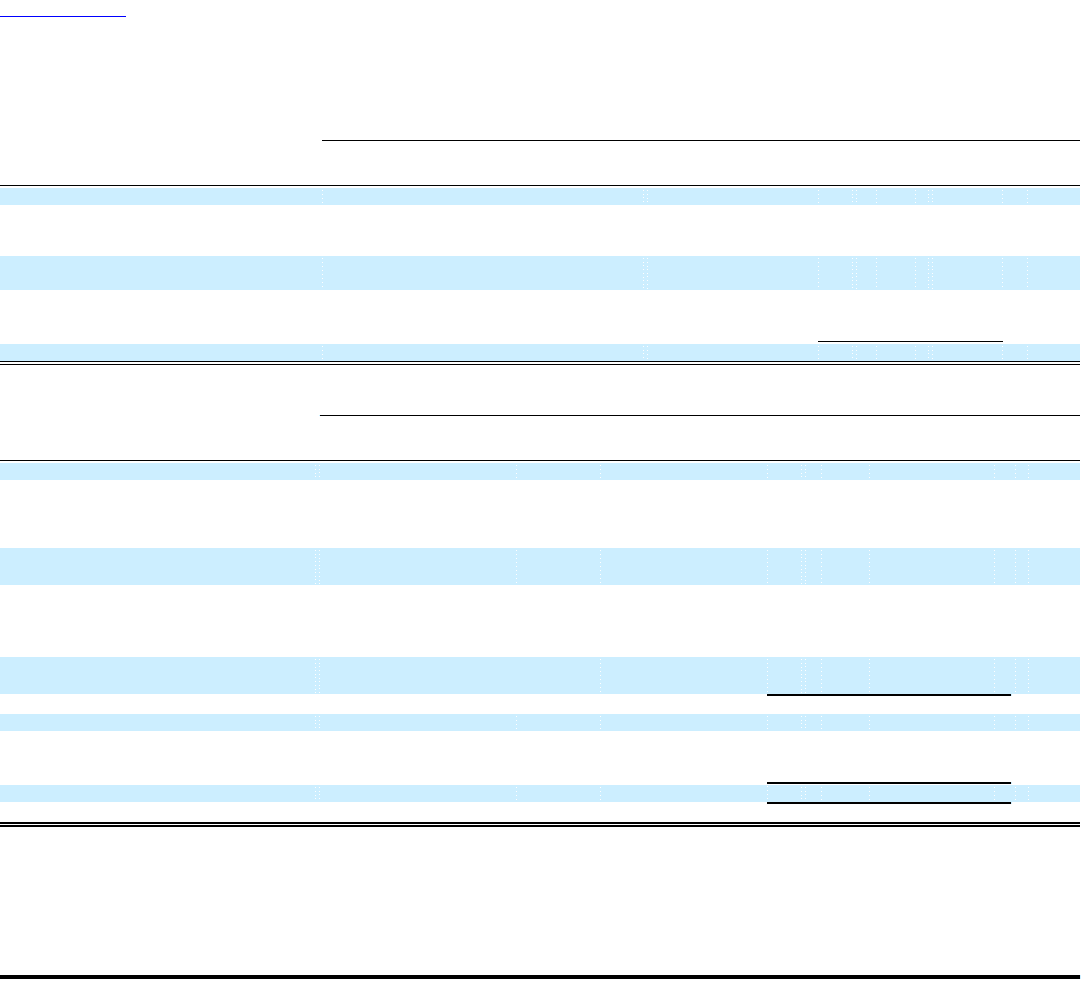
Table of Contents
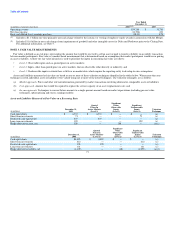
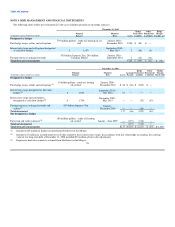
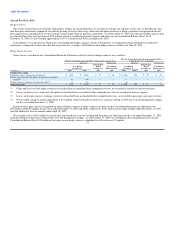
NOTE 4. RISK MANAGEMENT AND FINANCIAL INSTRUMENTS
The following tables reflect the estimated fair value asset (liability) position of our hedge contracts:
December 31, 2009
Hedge Other Hedge
Notional Maturity Derivatives Noncurrent Margin
(in millions, unless otherwise stated) Balance Date Assets Liability Liabilities Payable, net
Designated as hedges
Fuel hedge swaps, collars and call options 795 million gallons - crude oil, heating oil, jet
fuel January 2010 -
December 2010 $180 $ (89) $ —
Interest rate swaps and call options designated
as cash flow hedges $ 1,478 September 2010 -
May 2019 2 (38) (9)
Foreign currency exchange forwards 55.8 billion Japanese Yen; 295 million
Canadian Dollars January 2010 -
September 2012 1 (12) (12)
Total derivative instruments $183 $ (139) $ (21) $ (10)
December 31, 2008
Hedge Other Hedge
Notional Maturity Accounts Derivatives Noncurrent Margin
(in millions, unless otherwise stated) Balance Date Assets Payable Liability Liabilities Receivable
Designated as hedges
Fuel hedge swaps, collars and call options(1) 1.9 billion gallons - crude oil, heating
oil, jet fuel January 2009 -
December 2010 $ 26 $ (66) $ (849) $ —
Interest rate swaps designated as fair value
hedges(2) $ 1,000 September 2011 -
July 2012 91 — — —
Interest rate swaps and call options
designated as cash flow hedges(3) $ 1,700 December 2009 -
May 2019 — — (32) (63)
Foreign currency exchange forwards and
collars(3) 45.0 billion Japanese Yen January -
December 2009 — — (48) —
Total designated 117 (66) (929) (63)
Not designated as hedges
Fuel swap and collar contracts(3) 180 million gallons - crude oil, heating
oil, jet fuel January - June 2009 — (119) (318) —
Total not designated — (119) (318) —
Total derivative instruments $117 $ (185) $ (1,247) $ (63) $ 1,139
(1) Includes $163 million in hedges assumed from Northwest in the Merger.
(2) Includes $17 million in accrued interest receivables related to these interest rate swaps. In accordance with fair value hedge accounting, the carrying
value of our long-term debt at December 31, 2008 included $74 million of fair value adjustments.
(3) Represents derivative contracts assumed from Northwest in the Merger.76