Delta Airlines 2009 Annual Report Download - page 84
Download and view the complete annual report
Please find page 84 of the 2009 Delta Airlines annual report below. You can navigate through the pages in the report by either clicking on the pages listed below, or by using the keyword search tool below to find specific information within the annual report.-
 1
1 -
2
-
3
-
4
-
5
-
6
-
7
-
8
-
9
-
10
-
11
-
12
-
13
-
14
-
15
-
16
-
17
-
18
-
19
-
20
-
21
-
22
-
23
-
24
-
25
-
26
-
27
-
28
-
29
-
30
-
31
-
32
-
33
-
34
-
35
-
36
-
37
-
38
-
39
-
40
-
41
-
42
-
43
-
44
-
45
-
46
-
47
-
48
-
49
-
50
-
51
-
52
-
53
-
54
-
55
-
56
-
57
-
58
-
59
-
60
-
61
-
62
-
63
-
64
-
65
-
66
-
67
-
68
-
69
-
70
-
71
-
72
-
73
-
 74
74 -
 75
75 -
 76
76 -
 77
77 -
 78
78 -
 79
79 -
 80
80 -
 81
81 -
 82
82 -
 83
83 -
 84
84 -
 85
85 -
 86
86 -
 87
87 -
 88
88 -
 89
89 -
 90
90 -
 91
91 -
 92
92 -
 93
93 -
 94
94 -
95
-
96
-
97
-
98
-
99
-
100
-
101
-
102
-
103
-
104
-
105
-
106
-
107
-
108
-
109
-
110
-
111
-
112
-
113
-
114
-
115
-
116
-
117
-
118
-
119
-
120
-
121
-
122
-
123
-
124
-
125
-
126
-
127
-
128
-
129
-
130
-
131
-
132
-
133
-
134
-
135
-
136
-
137
-
138
-
139
-
140
-
141
-
142
-
143
-
144
-
145
-
146
-
147
-
148
-
149
-
150
-
151
-
152
-
153
-
154
-
155
-
156
-
157
-
158
-
159
-
160
-
161
-
162
-
163
-
164
-
165
-
166
-
167
-
168
-
169
-
170
-
171
-
172
-
173
-
174
-
175
-
176
-
177
-
178
-
179
 |
 |

Table of Contents
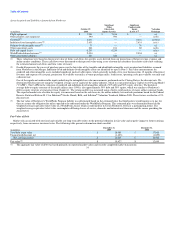
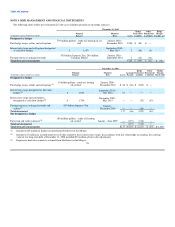
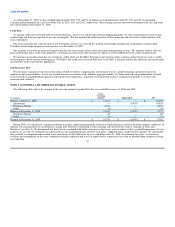
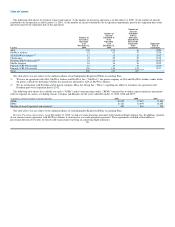
As of December 31, 2009, we have hedged approximately 29%, 21% and 5% of Japanese yen-denominated, and 24%, 15% and 4% of anticipated
Canadian dollar-denominated, cash flows from sales in 2010, 2011 and 2012, respectively. These foreign currency derivative instruments had a net fair value
loss of $23 million at December 31, 2009.
Credit Risk
To manage credit risk associated with our aircraft fuel price, interest rate and foreign currency hedging programs, we select counterparties based on their
credit ratings and limit our exposure to any one counterparty. We also monitor the market position of these programs and our relative market position with
each counterparty.
Due to the estimated fair value position of our fuel hedge contracts, we received $17 million in fuel hedge margin from counterparties and provided
$7 million in fuel hedge margin to counterparties as of December 31, 2009.
Our accounts receivable are generated largely from the sale of passenger airline tickets and cargo transportation services. The majority of these sales are
processed through major credit card companies, resulting in accounts receivable that may be subject to certain holdbacks by the credit card processors.
We also have receivables from the sale of mileage credits under our SkyMiles Program to participating airlines and non-airline businesses such as credit
card companies, hotels and car rental agencies. We believe the credit risk associated with these receivables is minimal and that the allowance for uncollectible
accounts that we have provided is appropriate.
Self-Insurance Risk
We self-insure a portion of our losses from claims related to workers' compensation, environmental issues, property damage, medical insurance for
employees and general liability. Losses are accrued based on an estimate of the ultimate aggregate liability for claims incurred, using independent actuarial
reviews based on standard industry practices and our historical experience. A portion of our projected workers' compensation liability is secured with
restricted cash collateral.
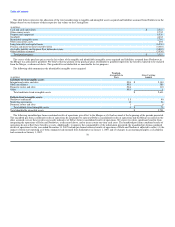
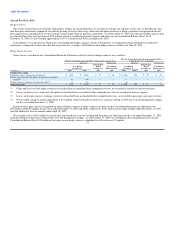
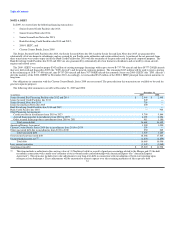
NOTE 5. GOODWILL AND OTHER INTANGIBLE ASSETS
The following table reflects the changes in the carrying amount of goodwill for the years ended December 31, 2008 and 2009:
Gross
Carrying
(in millions) Amount Impairment Net
Balance at January 1, 2008 $ 12,104 $ — $ 12,104
Impairment — (6,939) (6,939)
Northwest Merger 4,572 — 4,572
Other (6) — (6)
Balance at December 31, 2008 16,670 (6,939) 9,731
Northwest Merger 60 — 60
Other (4) — (4)
Balance at December 31, 2009 $ 16,726 $ (6,939) $ 9,787
During 2008, we experienced a significant decline in market capitalization primarily from record high fuel prices and overall airline industry conditions. In
addition, the announcement of our intention to merge with Northwest established a stock exchange ratio based on the relative valuation of Delta and
Northwest (see Note 2). We determined that these factors combined with further increases in fuel prices were an indicator that a goodwill impairment test was
required. As a result, we estimated fair value based on a discounted projection of future cash flows, supported with a market-based valuation. We determined
that goodwill was impaired and recorded a non-cash charge of $6.9 billion for the year ended December 31, 2008. In estimating fair value, we based our
estimates and assumptions on the same valuation techniques employed and levels of inputs used to estimate the fair value of goodwill upon adoption of fresh
start reporting. 79