Delta Airlines 2009 Annual Report Download - page 112
Download and view the complete annual report
Please find page 112 of the 2009 Delta Airlines annual report below. You can navigate through the pages in the report by either clicking on the pages listed below, or by using the keyword search tool below to find specific information within the annual report.-
 1
1 -
2
-
3
-
4
-
5
-
6
-
7
-
8
-
9
-
10
-
11
-
12
-
13
-
14
-
15
-
16
-
17
-
18
-
19
-
20
-
21
-
22
-
23
-
24
-
25
-
26
-
27
-
28
-
29
-
30
-
31
-
32
-
33
-
34
-
35
-
36
-
37
-
38
-
39
-
40
-
41
-
42
-
43
-
44
-
45
-
46
-
47
-
48
-
49
-
50
-
51
-
52
-
53
-
54
-
55
-
56
-
57
-
58
-
59
-
60
-
61
-
62
-
63
-
64
-
65
-
66
-
67
-
68
-
69
-
70
-
71
-
72
-
73
-
74
-
75
-
76
-
77
-
78
-
79
-
80
-
81
-
82
-
83
-
84
-
85
-
86
-
87
-
88
-
89
-
90
-
91
-
92
-
93
-
94
-
95
-
96
-
97
-
98
-
99
-
100
-
101
-
 102
102 -
 103
103 -
 104
104 -
 105
105 -
 106
106 -
 107
107 -
 108
108 -
 109
109 -
 110
110 -
 111
111 -
 112
112 -
 113
113 -
 114
114 -
 115
115 -
 116
116 -
 117
117 -
 118
118 -
 119
119 -
 120
120 -
 121
121 -
 122
122 -
123
-
124
-
125
-
126
-
127
-
128
-
129
-
130
-
131
-
132
-
133
-
134
-
135
-
136
-
137
-
138
-
139
-
140
-
141
-
142
-
143
-
144
-
145
-
146
-
147
-
148
-
149
-
150
-
151
-
152
-
153
-
154
-
155
-
156
-
157
-
158
-
159
-
160
-
161
-
162
-
163
-
164
-
165
-
166
-
167
-
168
-
169
-
170
-
171
-
172
-
173
-
174
-
175
-
176
-
177
-
178
-
179
 |
 |

Table of Contents
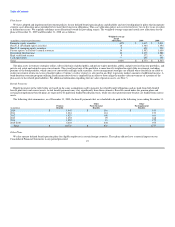
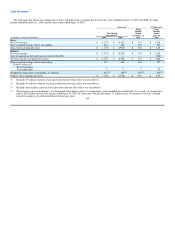
Operating revenue is assigned to a specific geographic region based on the origin, flight path and destination of each flight segment. Our operating revenue
by geographic region for the years ended December 31, 2009 and 2008, the eight months ended December 31, 2007 and the four months ended April 30, 2007
are summarized in the following table:
Successor Predecessor
Eight Months Four Months
Year Ended Ended Ended
December 31, December 31, April 30,
(in millions) 2009 2008 2007 2007
Domestic $ 19,171 $ 15,065 $9,380 $ 4,314
Atlantic 4,970 5,149 2,884 947
Latin America 1,437 1,616 923 478
Pacific 2,485 867 171 57
Total $ 28,063 $ 22,697 $ 13,358 $ 5,796
Our tangible assets consist primarily of flight equipment, which is mobile across geographic markets. Accordingly, assets are not allocated to specific
geographic regions.
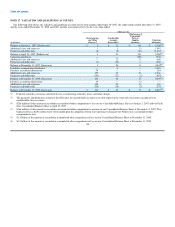
NOTE 15. RESTRUCTURING AND MERGER-RELATED ITEMS
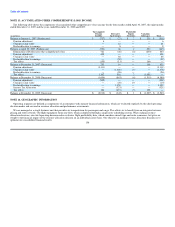
The following table shows charges recorded in restructuring and merger-related items on our Consolidated Statements of Operations for the years ended
December 31, 2009 and 2008:
Year Ended
December 31,
(in millions) 2009 2008
Severance and related costs $ 119 $114
Contract Carrier restructuring — 14
Facilities and other 13 25
Merger-related items 275 978
Total restructuring and merger-related items $ 407 $ 1,131
Severance and related costs primarily relate to voluntary workforce reduction programs for U.S. employees. In 2009, we recorded $119 million associated
with workforce reduction programs, including $6 million of special termination benefits related to retiree healthcare. We expect any additional charges
incurred under these programs will not be material. In 2008, we recorded $114 million associated with workforce reduction programs.
Contract Carrier restructuring costs relate primarily to the early termination of certain capacity purchase agreements with our Contract Carriers.
Facilities and other costs primarily relate to the closing operations in airports. In 2008, the costs primarily relate to the closing of operations in Concourse
C at the Cincinnati/Northern Kentucky International Airport. Upon our exit from Concourse C, we recorded a one-time charge of $18 million based on the
estimated present value of future rents.
Merger-related items relate to costs associated with integrating the operations of Northwest into Delta, including costs related to information technology,
employee relocation and training, and re-branding of aircraft and stations.
We did not have any restructuring and merger-related items in 2007.
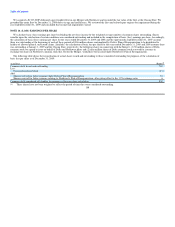
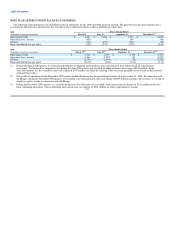
The following table shows the balances for restructuring charges as of December 31, 2009, and the activity for the year then ended:
Liability Liability
Balance at Additional Purchase Balance at
December 31, Costs and Accounting December 31,
(in millions) 2008 Expenses Adjustments Payments 2009
Severance and related costs(1) $ 50 $ 113 $ — $ (94) $ 69
Facilities and other(1) 54 13 19 (12) 74
Total $ 104 $ 126 $ 19 $ (106) $ 143
(1) The liability balance at December 31, 2008 includes liabilities assumed in the Merger of $47 million in severance and related costs and $32 million in
restructuring of facility leases and other charges. 107