Delta Airlines 2009 Annual Report Download - page 40
Download and view the complete annual report
Please find page 40 of the 2009 Delta Airlines annual report below. You can navigate through the pages in the report by either clicking on the pages listed below, or by using the keyword search tool below to find specific information within the annual report.-
 1
1 -
2
-
3
-
4
-
5
-
6
-
7
-
8
-
9
-
10
-
11
-
12
-
13
-
14
-
15
-
16
-
17
-
18
-
19
-
20
-
21
-
22
-
23
-
24
-
25
-
26
-
27
-
28
-
29
-
 30
30 -
 31
31 -
 32
32 -
 33
33 -
 34
34 -
 35
35 -
 36
36 -
 37
37 -
 38
38 -
 39
39 -
 40
40 -
 41
41 -
 42
42 -
 43
43 -
 44
44 -
 45
45 -
 46
46 -
 47
47 -
 48
48 -
 49
49 -
 50
50 -
51
-
52
-
53
-
54
-
55
-
56
-
57
-
58
-
59
-
60
-
61
-
62
-
63
-
64
-
65
-
66
-
67
-
68
-
69
-
70
-
71
-
72
-
73
-
74
-
75
-
76
-
77
-
78
-
79
-
80
-
81
-
82
-
83
-
84
-
85
-
86
-
87
-
88
-
89
-
90
-
91
-
92
-
93
-
94
-
95
-
96
-
97
-
98
-
99
-
100
-
101
-
102
-
103
-
104
-
105
-
106
-
107
-
108
-
109
-
110
-
111
-
112
-
113
-
114
-
115
-
116
-
117
-
118
-
119
-
120
-
121
-
122
-
123
-
124
-
125
-
126
-
127
-
128
-
129
-
130
-
131
-
132
-
133
-
134
-
135
-
136
-
137
-
138
-
139
-
140
-
141
-
142
-
143
-
144
-
145
-
146
-
147
-
148
-
149
-
150
-
151
-
152
-
153
-
154
-
155
-
156
-
157
-
158
-
159
-
160
-
161
-
162
-
163
-
164
-
165
-
166
-
167
-
168
-
169
-
170
-
171
-
172
-
173
-
174
-
175
-
176
-
177
-
178
-
179
 |
 |

Table of Contents
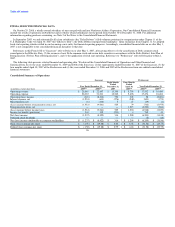
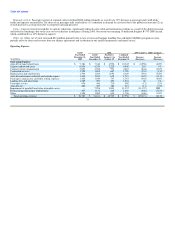
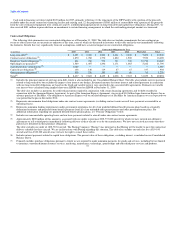
Increase (Decrease)
2008 GAAP
vs. 2007 Predecessor + Successor
GAAP
Year Ended Passenger
December 31, Mile Load
(in millions) 2008 Yield PRASM Factor
Passenger Revenue:
Domestic $ 8,707 4% 6% 2.1pts
Atlantic 4,390 9% 7% (1.2)pts
Latin America 1,362 13% 16% 2.1pts
Pacific 678 4% 4% 0.2pts
Total Mainline 15,137 6% 7% 1.0pts
Regional carriers 4,446 5% 6% 0.8pts
Total passenger revenue $ 19,583 5% 6% 1.0pts
Mainline Passenger Revenue. Mainline passenger revenue increased in 2008 compared to the 2007 Predecessor plus Successor results primarily due to
(1) the inclusion of Northwest's operations, (2) fare increases in response to increased fuel charges, (3) pricing and scheduling initiatives and (4) our increased
service to international destinations. The increase in passenger revenue reflects a rise of 6% and 7% in passenger mile yield and PRASM, respectively.
• Domestic Passenger Revenue. Domestic passenger revenue increased 8%, due to a 2.1 point increase in load factor and a 6% increase in PRASM on
a 1% increase in capacity. The passenger mile yield increased 4%. The increases in passenger revenue and PRASM reflect (1) the inclusion of
Northwest's operations and (2) fare increases, higher yields and our reduction of domestic flights in response to high fuel prices and the slowing
economy. Excluding Northwest's operations, we reduced domestic capacity by 7% for the year.
• International Passenger Revenue. International passenger revenue increased 38%, due to a 27% increase in capacity from growth in our
international operations and the inclusion of Northwest's operations, and a 9% increase in PRASM. The passenger mile yield increased 9% due to
fuel surcharges and increases in service to international destinations, primarily in the Atlantic and Latin America markets, from the restructuring of
our route network. Excluding Northwest's operations, we increased international capacity by 14% for the year.
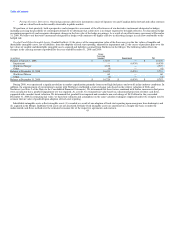
Regional carriers. Passenger revenue of regional affiliates increased due to the inclusion of Northwest's operations. Excluding Northwest's operations,
regional carriers revenue declined $58 million primarily due to an 8% decrease in capacity in response to high fuel prices and the slowing economy, as well as
the termination of certain contract carrier agreements.
Cargo. Cargo revenue increased due to the inclusion of Northwest's operations and an increase in fuel surcharges, improved cargo yields, and higher
international volume.
Other, net. Other, net revenue increased primarily due to the inclusion of Northwest's operations. Excluding Northwest's operations, other, net revenue
increased $485 million primarily due to (1) new or increased administrative service charges and baggage handling fees, (2) growth in aircraft maintenance and
staffing services to third parties and (3) higher SkyMiles program revenue. 35