Delta Airlines 2009 Annual Report Download - page 32
Download and view the complete annual report
Please find page 32 of the 2009 Delta Airlines annual report below. You can navigate through the pages in the report by either clicking on the pages listed below, or by using the keyword search tool below to find specific information within the annual report.-
 1
1 -
2
-
3
-
4
-
5
-
6
-
7
-
8
-
9
-
10
-
11
-
12
-
13
-
14
-
15
-
16
-
17
-
18
-
19
-
20
-
21
-
 22
22 -
 23
23 -
 24
24 -
 25
25 -
 26
26 -
 27
27 -
 28
28 -
 29
29 -
 30
30 -
 31
31 -
 32
32 -
 33
33 -
 34
34 -
 35
35 -
 36
36 -
 37
37 -
 38
38 -
 39
39 -
 40
40 -
 41
41 -
 42
42 -
43
-
44
-
45
-
46
-
47
-
48
-
49
-
50
-
51
-
52
-
53
-
54
-
55
-
56
-
57
-
58
-
59
-
60
-
61
-
62
-
63
-
64
-
65
-
66
-
67
-
68
-
69
-
70
-
71
-
72
-
73
-
74
-
75
-
76
-
77
-
78
-
79
-
80
-
81
-
82
-
83
-
84
-
85
-
86
-
87
-
88
-
89
-
90
-
91
-
92
-
93
-
94
-
95
-
96
-
97
-
98
-
99
-
100
-
101
-
102
-
103
-
104
-
105
-
106
-
107
-
108
-
109
-
110
-
111
-
112
-
113
-
114
-
115
-
116
-
117
-
118
-
119
-
120
-
121
-
122
-
123
-
124
-
125
-
126
-
127
-
128
-
129
-
130
-
131
-
132
-
133
-
134
-
135
-
136
-
137
-
138
-
139
-
140
-
141
-
142
-
143
-
144
-
145
-
146
-
147
-
148
-
149
-
150
-
151
-
152
-
153
-
154
-
155
-
156
-
157
-
158
-
159
-
160
-
161
-
162
-
163
-
164
-
165
-
166
-
167
-
168
-
169
-
170
-
171
-
172
-
173
-
174
-
175
-
176
-
177
-
178
-
179
 |
 |
Table of Contents
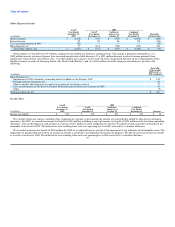
(1) Includes (a) $407 million, or $0.49 diluted loss per share, in restructuring and merger-related charges associated with (i) integrating the operations of
Northwest into Delta, including costs related to information technology, employee relocation and training, and re-branding of aircraft and stations and
(ii) employee workforce reduction programs, (b) an $83 million non-cash loss for the write-off of the unamortized discount on the extinguishment of
the Northwest senior secured exit financing facility and (c) a non-cash income tax benefit of $321 million from our consideration of all income sources,
including other comprehensive income.
(2) Includes a $7.3 billion non-cash charge, or $15.59 diluted loss per share, from an impairment of goodwill and other intangible assets and $1.1 billion, or
$2.42 diluted loss per share, in primarily non-cash merger-related charges relating to the issuance or vesting of employee equity awards in connection
with our merger with Northwest.
(3) Includes a $1.2 billion non-cash gain, or $5.20 diluted earnings per share, for reorganization items.
(4) Includes a $6.2 billion non-cash charge, or $31.58 diluted earnings per share, for reorganization items, a $310 million non-cash charge, or $1.58 diluted
loss per share, associated with certain accounting adjustments and a $765 million income tax benefit, or $3.89 diluted EPS.
(5) Includes an $888 million charge, or $5.49 diluted loss per share, for restructuring, asset writedowns, pension settlements and related items, net and an
$884 million non-cash charge, or $5.47 diluted loss per share, for reorganization costs.
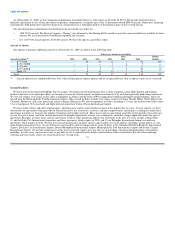
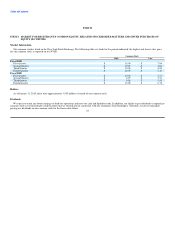
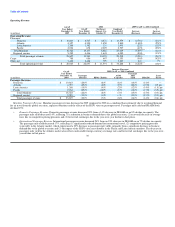
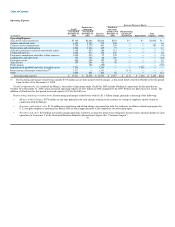
Other Financial and Statistical Data
(Unaudited)
Successor Predecessor
Eight Months Four Months
Year Ended Ended Ended Year Ended
December 31, December 31, April 30, December 31,
2009 2008 2007 2007 2006 2005
Revenue passenger miles (millions)(1) 188,943 134,879 85,029 37,036 116,133 119,954
Available seat miles (millions)(1) 230,331 165,639 104,427 47,337 147,995 156,793
Passenger mile yield(1) 12.60¢ 14.52¢ 13.88¢ 13.84¢ 13.34¢ 12.16¢
Passenger revenue per available seat mile(1) 10.34¢ 11.82¢ 11.30¢ 10.83¢ 10.47¢ 9.31¢
Operating cost per available seat mile(1) 12.32¢ 18.72¢ 12.03¢ 11.61¢ 11.80¢ 11.79¢
Passenger load factor(1) 82.0% 81.4% 81.4% 78.2% 78.5% 76.5%
Fuel gallons consumed (millions)(1) 3,853 2,740 1,742 792 2,480 2,687
Average price per fuel gallon, net of hedging(1) $ 2.15 $ 3.16 $ 2.38 $ 1.93 $ 2.12 $ 1.89
Full-time equivalent employees, end of period 81,106 84,306 55,044 52,704 51,322 55,650
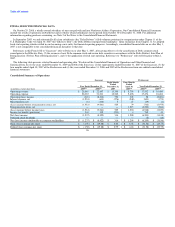
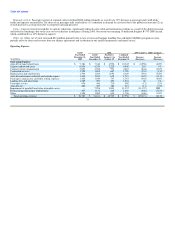
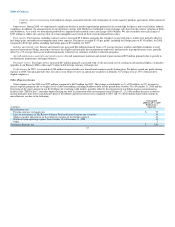
Successor Predecessor
December 31, December 31,
2009 2008 2007 2006 2005
Total assets (millions)(1) $ 43,539 $ 45,084 $ 32,423 $ 19,622 $ 20,039
Long-term debt and capital leases (including current maturities) (millions)(1) $ 17,198 $ 16,571 $ 9,000 $ 8,012 $ 7,743
Stockholders' equity (deficit) (millions)(1) $ 245 $ 874 $ 10,113 $ (13,593) $ (9,895)
Common stock outstanding (millions) 784 695 292 197 189
(1) Includes the operations of our contract carriers under capacity purchase agreements, including non-owned carriers.
27