Delta Airlines 2009 Annual Report Download - page 33
Download and view the complete annual report
Please find page 33 of the 2009 Delta Airlines annual report below. You can navigate through the pages in the report by either clicking on the pages listed below, or by using the keyword search tool below to find specific information within the annual report.-
 1
1 -
2
-
3
-
4
-
5
-
6
-
7
-
8
-
9
-
10
-
11
-
12
-
13
-
14
-
15
-
16
-
17
-
18
-
19
-
20
-
21
-
22
-
 23
23 -
 24
24 -
 25
25 -
 26
26 -
 27
27 -
 28
28 -
 29
29 -
 30
30 -
 31
31 -
 32
32 -
 33
33 -
 34
34 -
 35
35 -
 36
36 -
 37
37 -
 38
38 -
 39
39 -
 40
40 -
 41
41 -
 42
42 -
 43
43 -
44
-
45
-
46
-
47
-
48
-
49
-
50
-
51
-
52
-
53
-
54
-
55
-
56
-
57
-
58
-
59
-
60
-
61
-
62
-
63
-
64
-
65
-
66
-
67
-
68
-
69
-
70
-
71
-
72
-
73
-
74
-
75
-
76
-
77
-
78
-
79
-
80
-
81
-
82
-
83
-
84
-
85
-
86
-
87
-
88
-
89
-
90
-
91
-
92
-
93
-
94
-
95
-
96
-
97
-
98
-
99
-
100
-
101
-
102
-
103
-
104
-
105
-
106
-
107
-
108
-
109
-
110
-
111
-
112
-
113
-
114
-
115
-
116
-
117
-
118
-
119
-
120
-
121
-
122
-
123
-
124
-
125
-
126
-
127
-
128
-
129
-
130
-
131
-
132
-
133
-
134
-
135
-
136
-
137
-
138
-
139
-
140
-
141
-
142
-
143
-
144
-
145
-
146
-
147
-
148
-
149
-
150
-
151
-
152
-
153
-
154
-
155
-
156
-
157
-
158
-
159
-
160
-
161
-
162
-
163
-
164
-
165
-
166
-
167
-
168
-
169
-
170
-
171
-
172
-
173
-
174
-
175
-
176
-
177
-
178
-
179
 |
 |

Table of Contents
ITEM 7. MANAGEMENT'S DISCUSSION AND ANALYSIS OF FINANCIAL CONDITION AND RESULTS OF OPERATIONS
General Information
We provide scheduled air transportation for passengers and cargo throughout the United States ("U.S.") and around the world. On October 29, 2008 (the
"Closing Date"), a wholly-owned subsidiary of ours merged (the "Merger") with and into Northwest Airlines Corporation. On the Closing Date, Northwest
Airlines Corporation and its wholly-owned subsidiaries, including Northwest Airlines, Inc. (collectively, "Northwest"), became wholly-owned subsidiaries of
Delta. On December 31, 2009, Northwest Airlines, Inc. merged with and into Delta. As a result of this merger, Northwest Airlines, Inc. ceased to exist as a
separate entity. We believe the Merger better positions us to manage through economic cycles and volatile fuel prices, invest in our fleet, improve services for
customers and achieve our strategic objectives.
Our Consolidated Financial Statements are prepared in accordance with accounting principles generally accepted in the U.S. ("GAAP"). In accordance
with GAAP, our financial results include the results of Northwest for the periods after the Closing Date, but not for periods on or before the Closing Date. Our
financial results under GAAP for the year ended December 31, 2009 include the results of Northwest for the full year. In contrast, our financial results under
GAAP for the year ended December 31, 2008 include the results of Northwest only from October 30 to December 31, 2008. Accordingly, our financial results
under GAAP for the years ended December 31, 2009 and 2008 are not comparable.
In the accompanying "Financial Highlights — 2009 GAAP Compared to 2008 Combined" and "Results of Operations — 2009 GAAP Compared to 2008
Combined," we sometimes use information that is derived from our Consolidated Financial Statements, but that is not presented in accordance with GAAP.
Certain of this information is considered "non-GAAP financial measures" under the U.S. Securities and Exchange Commission rules. These non-GAAP
financial measures include financial information for the year ended December 31, 2008 presented on a combined basis, which means the financial results for
pre-Merger Delta and pre-Merger Northwest are combined beginning January 1, 2008. We believe this presentation of the 2008 financial results provides a
more meaningful basis for comparing Delta's financial performance in 2009 and 2008. See "Results of Operations — 2009 GAAP Compared to 2008
Combined" and "Supplemental Information" below for the reasons we use combined and other non-GAAP financial measures, as well as a reconciliation to
the corresponding measures under GAAP. The non-GAAP financial measures should be considered in addition to results prepared in accordance with GAAP,
but should not be considered a substitute for or superior to GAAP results.
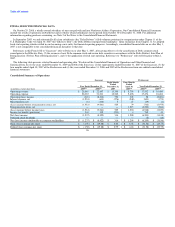
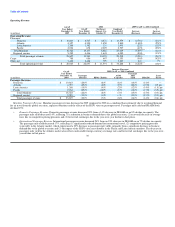
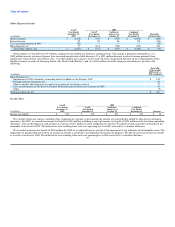
Financial Highlights — 2009 GAAP Compared to 2008 Combined
For 2009, we reported a net loss of $1.2 billion. These results reflect significant weakness in the airline revenue environment due to the global recession
and $1.4 billion in fuel hedge losses. Our net loss for the year also includes a $407 million charge for merger-related items, a $321 million non-cash income
tax benefit and an $83 million non-cash loss on the extinguishment of debt.
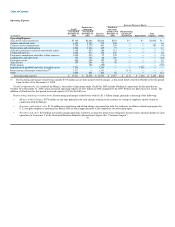
Total operating revenue declined $6.2 billion, or 18%, in 2009 on a 6% decrease in system capacity, or available seat mile ("ASMs"), compared with 2008
on a combined basis. Passenger revenue accounted for $5.9 billion of the decrease. Passenger revenue per ASM ("PRASM") declined 14% on a 14% decrease
in passenger mile yield. The decrease in passenger mile yield reflects (1) significantly reduced demand, particularly in international markets, (2) a reduction in
business demand, (3) competitive pricing pressures and (4) lower fuel surcharges due to the year-over-year decline on fuel prices.
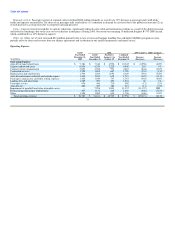
Volatile fuel prices continue to represent a significant risk to our business and the airline industry as a whole. While our fuel cost per gallon declined 35%
in 2009 compared to 2008 on a combined basis, contributing to $5.4 billion in lower fuel expense excluding the mark-to-market adjustments related to fuel
hedges settling in future periods, crude oil prices have risen 78% from December 31, 2008 to December 31, 2009.
We have focused on maintaining a competitive cost structure through disciplined spending, productivity initiatives and accelerating Merger synergies. Our
consolidated operating cost per ASM ("CASM"), excluding special items (as defined in "Supplemental Information" below) and fuel expense, increased 4%
on a 6% lower capacity in 2009 compared to 2008 on a combined basis. The increase primarily reflects an increase in pension expense from a decrease in
value in pension trust assets due to declines in the financial markets during 2008.
28