Delta Airlines 2009 Annual Report Download - page 111
Download and view the complete annual report
Please find page 111 of the 2009 Delta Airlines annual report below. You can navigate through the pages in the report by either clicking on the pages listed below, or by using the keyword search tool below to find specific information within the annual report.-
 1
1 -
2
-
3
-
4
-
5
-
6
-
7
-
8
-
9
-
10
-
11
-
12
-
13
-
14
-
15
-
16
-
17
-
18
-
19
-
20
-
21
-
22
-
23
-
24
-
25
-
26
-
27
-
28
-
29
-
30
-
31
-
32
-
33
-
34
-
35
-
36
-
37
-
38
-
39
-
40
-
41
-
42
-
43
-
44
-
45
-
46
-
47
-
48
-
49
-
50
-
51
-
52
-
53
-
54
-
55
-
56
-
57
-
58
-
59
-
60
-
61
-
62
-
63
-
64
-
65
-
66
-
67
-
68
-
69
-
70
-
71
-
72
-
73
-
74
-
75
-
76
-
77
-
78
-
79
-
80
-
81
-
82
-
83
-
84
-
85
-
86
-
87
-
88
-
89
-
90
-
91
-
92
-
93
-
94
-
95
-
96
-
97
-
98
-
99
-
100
-
 101
101 -
 102
102 -
 103
103 -
 104
104 -
 105
105 -
 106
106 -
 107
107 -
 108
108 -
 109
109 -
 110
110 -
 111
111 -
 112
112 -
 113
113 -
 114
114 -
 115
115 -
 116
116 -
 117
117 -
 118
118 -
 119
119 -
 120
120 -
 121
121 -
122
-
123
-
124
-
125
-
126
-
127
-
128
-
129
-
130
-
131
-
132
-
133
-
134
-
135
-
136
-
137
-
138
-
139
-
140
-
141
-
142
-
143
-
144
-
145
-
146
-
147
-
148
-
149
-
150
-
151
-
152
-
153
-
154
-
155
-
156
-
157
-
158
-
159
-
160
-
161
-
162
-
163
-
164
-
165
-
166
-
167
-
168
-
169
-
170
-
171
-
172
-
173
-
174
-
175
-
176
-
177
-
178
-
179
 |
 |
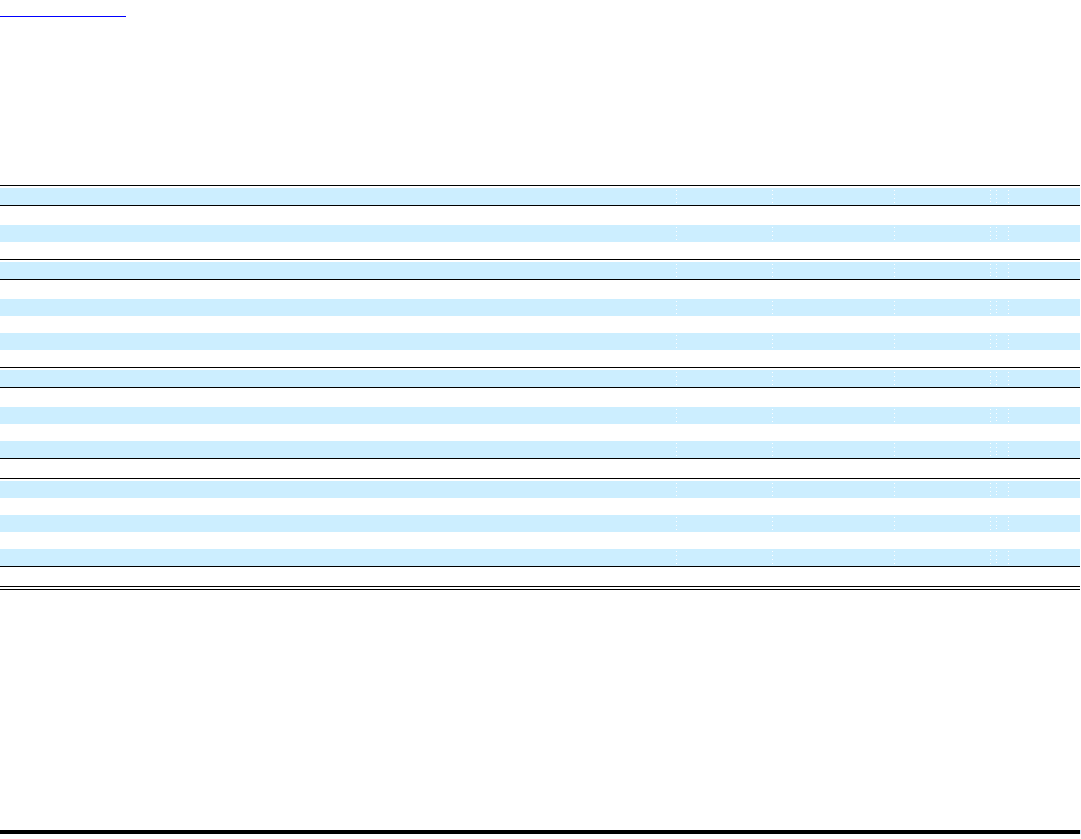
Table of Contents
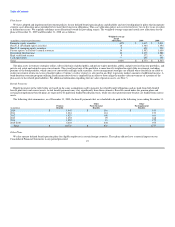
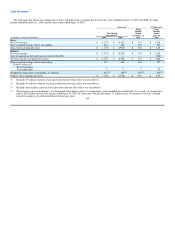
NOTE 13. ACCUMULATED OTHER COMPREHENSIVE (LOSS) INCOME
The following table shows the components of accumulated other comprehensive (loss) income for the four months ended April 30, 2007, the eight months
ended December 31, 2007 and the years ended December 31, 2008 and 2009:
Unrecognized Marketable
Pension Derivative Equity Valuation
(in millions) Liability Instruments Securities Allowance Total
Balance at January 1, 2007 (Predecessor) $ (727) $ (23) $ 2 $ 230 $ (518)
Pension adjustment 6 — — — 6
Changes in fair value — 61 — — 61
Reclassification to earnings — 8 — — 8
Balance at April 30, 2007 (Predecessor) (721) 46 2 230 (443)
Elimination of Predecessor other comprehensive loss 721 (46) (2) (230) 443
Pension adjustment 408 — — — 408
Changes in fair value — 86 — — 86
Reclassification to earnings — (59) — — (59)
Tax effect (155) (11) — 166 —
Balance at December 31, 2007 (Successor) 253 16 — 166 435
Pension adjustment (3,111) — — — (3,111)
Changes in fair value — (1,369) (9) — (1,378)
Reclassification to earnings — (26) — — (26)
Tax effect 1,162 516 3 (1,681) —
Balance at December 31, 2008 (Successor) (1,696) (863) (6) (1,515) (4,080)
Pension adjustment (502) — — — (502)
Changes in fair value — (20) 10 — (10)
Reclassification to earnings — 1,350 — — 1,350
Income Tax Allocation — (321) — — (321)
Tax effect 186 (491) (3) 308 —
Balance at December 31, 2009 (Successor) $ (2,012) $ (345) $ 1 $ (1,207) $ (3,563)
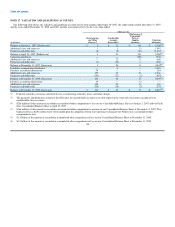
NOTE 14. GEOGRAPHIC INFORMATION
Operating segments are defined as components of an enterprise with separate financial information, which are evaluated regularly by the chief operating
decision maker and are used in resource allocation and performance assessments.
We are managed as a single business unit that provides air transportation for passengers and cargo. This allows us to benefit from an integrated revenue
pricing and route network. Our flight equipment forms one fleet, which is deployed through a single route scheduling system. When making resource
allocation decisions, our chief operating decision maker evaluates flight profitability data, which considers aircraft type and route economics, but gives no
weight to the financial impact of the resource allocation decision on an individual carrier basis. Our objective in making resource allocation decisions is to
optimize our consolidated financial results. 106