Delta Airlines 2009 Annual Report Download - page 116
Download and view the complete annual report
Please find page 116 of the 2009 Delta Airlines annual report below. You can navigate through the pages in the report by either clicking on the pages listed below, or by using the keyword search tool below to find specific information within the annual report.-
 1
1 -
2
-
3
-
4
-
5
-
6
-
7
-
8
-
9
-
10
-
11
-
12
-
13
-
14
-
15
-
16
-
17
-
18
-
19
-
20
-
21
-
22
-
23
-
24
-
25
-
26
-
27
-
28
-
29
-
30
-
31
-
32
-
33
-
34
-
35
-
36
-
37
-
38
-
39
-
40
-
41
-
42
-
43
-
44
-
45
-
46
-
47
-
48
-
49
-
50
-
51
-
52
-
53
-
54
-
55
-
56
-
57
-
58
-
59
-
60
-
61
-
62
-
63
-
64
-
65
-
66
-
67
-
68
-
69
-
70
-
71
-
72
-
73
-
74
-
75
-
76
-
77
-
78
-
79
-
80
-
81
-
82
-
83
-
84
-
85
-
86
-
87
-
88
-
89
-
90
-
91
-
92
-
93
-
94
-
95
-
96
-
97
-
98
-
99
-
100
-
101
-
102
-
103
-
104
-
105
-
 106
106 -
 107
107 -
 108
108 -
 109
109 -
 110
110 -
 111
111 -
 112
112 -
 113
113 -
 114
114 -
 115
115 -
 116
116 -
 117
117 -
 118
118 -
 119
119 -
 120
120 -
 121
121 -
 122
122 -
 123
123 -
 124
124 -
 125
125 -
 126
126 -
127
-
128
-
129
-
130
-
131
-
132
-
133
-
134
-
135
-
136
-
137
-
138
-
139
-
140
-
141
-
142
-
143
-
144
-
145
-
146
-
147
-
148
-
149
-
150
-
151
-
152
-
153
-
154
-
155
-
156
-
157
-
158
-
159
-
160
-
161
-
162
-
163
-
164
-
165
-
166
-
167
-
168
-
169
-
170
-
171
-
172
-
173
-
174
-
175
-
176
-
177
-
178
-
179
 |
 |
Table of Contents
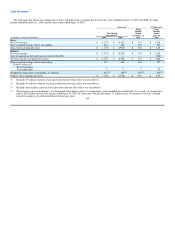
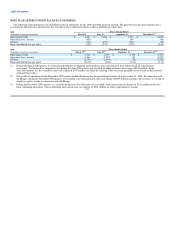
NOTE 18. QUARTERLY FINANCIAL DATA (UNAUDITED)
The following table summarizes our unaudited results of operations for the 2009 and 2008 quarterly periods. The quarterly loss per share amounts for a
year will not add to the loss per share for that year due to the weighting of shares used in calculating per share data.
2009 Three Months Ended
(in millions, except per share data) March 31 June 30 September 30 December 31(3)
Operating revenue $ 6,684 $ 7,000 $ 7,574 $ 6,805
Operating (loss) income (483) 1 204 (46)
Net loss (794) (257) (161) (25)
Basic and diluted loss per share (0.96) (0.31) (0.19) (0.03)
2008 Three Months Ended
(in millions, except per share data) March 31(1) June 30(1) September 30 December 31(2)
Operating revenue $ 4,766 $ 5,499 $ 5,719 $ 6,713
Operating (loss) income (6,261) (1,087) 131 (1,097)
Net loss (6,390) (1,044) (50) (1,438)
Basic and diluted loss per share (16.15) (2.64) (0.13) (2.11)
(1) During the March 2008 quarter, we determined goodwill was impaired and recorded a non-cash charge of $6.1 billion based on a preliminary
assessment. We finalized the impairment test during the June 2008 quarter and recorded an additional non-cash charge of $839 million. In the
June 2008 quarter, we also recorded a non-cash charge of $357 million to reduce the carrying value of certain intangible assets based on their revised
estimated fair values.
(2) Our results of operations for the December 2008 quarter include Northwest for the period from October 30 to December 31, 2008. In connection with
the Merger, during the December 2008 quarter, we recorded a one-time primarily non-cash charge of $969 million relating to the issuance or vesting of
employee equity awards in connection with the Merger.
(3) During the December 2009 quarter, as a result of the Income Tax Allocation, we recorded a non-cash income tax benefit of $321 million on the loss
from continuing operations, with an offsetting non-cash income tax expense of $321 million on other comprehensive income.
111