Delta Airlines 2009 Annual Report Download - page 105
Download and view the complete annual report
Please find page 105 of the 2009 Delta Airlines annual report below. You can navigate through the pages in the report by either clicking on the pages listed below, or by using the keyword search tool below to find specific information within the annual report.-
 1
1 -
2
-
3
-
4
-
5
-
6
-
7
-
8
-
9
-
10
-
11
-
12
-
13
-
14
-
15
-
16
-
17
-
18
-
19
-
20
-
21
-
22
-
23
-
24
-
25
-
26
-
27
-
28
-
29
-
30
-
31
-
32
-
33
-
34
-
35
-
36
-
37
-
38
-
39
-
40
-
41
-
42
-
43
-
44
-
45
-
46
-
47
-
48
-
49
-
50
-
51
-
52
-
53
-
54
-
55
-
56
-
57
-
58
-
59
-
60
-
61
-
62
-
63
-
64
-
65
-
66
-
67
-
68
-
69
-
70
-
71
-
72
-
73
-
74
-
75
-
76
-
77
-
78
-
79
-
80
-
81
-
82
-
83
-
84
-
85
-
86
-
87
-
88
-
89
-
90
-
91
-
92
-
93
-
94
-
 95
95 -
 96
96 -
 97
97 -
 98
98 -
 99
99 -
 100
100 -
 101
101 -
 102
102 -
 103
103 -
 104
104 -
 105
105 -
 106
106 -
 107
107 -
 108
108 -
 109
109 -
 110
110 -
 111
111 -
 112
112 -
 113
113 -
 114
114 -
 115
115 -
116
-
117
-
118
-
119
-
120
-
121
-
122
-
123
-
124
-
125
-
126
-
127
-
128
-
129
-
130
-
131
-
132
-
133
-
134
-
135
-
136
-
137
-
138
-
139
-
140
-
141
-
142
-
143
-
144
-
145
-
146
-
147
-
148
-
149
-
150
-
151
-
152
-
153
-
154
-
155
-
156
-
157
-
158
-
159
-
160
-
161
-
162
-
163
-
164
-
165
-
166
-
167
-
168
-
169
-
170
-
171
-
172
-
173
-
174
-
175
-
176
-
177
-
178
-
179
 |
 |

Table of Contents
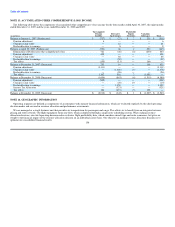
(9) For the four months ended April 30, 2007, we recorded a net $43 million gain, primarily reflecting a $126 million net gain in connection with our
settlement agreement with the Massachusetts Port Authority, which was partially offset by a net $80 million charge from an allowed general, unsecured
claim in connection with our settlement agreement with the Kenton County Airport Board (the "Cincinnati Airport Settlement Agreement").
(10) Allowed general, unsecured claims in connection with agreements reached with committees representing pilot and non-pilot retired employees reducing
their postretirement healthcare benefits.
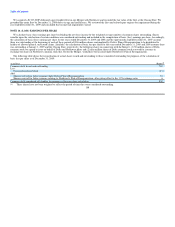
Fresh Start Consolidated Balance Sheet
Upon emergence from Chapter 11, we adopted fresh start reporting, which required us to revalue our assets and liabilities to fair value. Fair value is
defined as an exit price, representing the amount that would be received to sell an asset or paid to transfer a liability in an orderly transaction between market
participants. Accordingly, fair value is a market-based measurement that is determined based on assumptions that market participants would use in pricing an
asset or liability.
To facilitate the calculation of the reorganization value of the Successor, management developed financial projections for the Successor using a number of
estimates and assumptions. The reorganization value of the Successor was primarily based on financial projections using various valuation methods, including
(1) a comparison of our projected performance to the market values of comparable companies and (2) a calculation of the present value of future cash flows
based on our projections. Utilizing these methodologies, the reorganization value of the Successor was estimated to be in the range of $9.4 billion and
$12.0 billion. The reorganization value was dependent upon achieving the future financial results set forth in our projections, as well as the realization of
certain other assumptions. There can be no assurance the projections will be achieved or the assumptions will be realized. The excess reorganization value
(using the low end of the range) over the fair value of tangible and identifiable intangible assets, net of liabilities, was reflected as goodwill in the Fresh Start
Consolidated Balance Sheet. The financial projections and estimates of reorganization value are not incorporated in this Form 10-K.
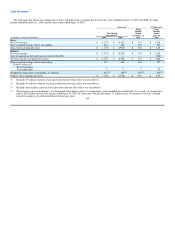
The methodologies used to calculate reorganization value primarily include (1) a 60% weighting towards a discounted cash flow ("DCF") analysis, which
measures the projected multi-year, free cash flows of the Successor to arrive at a reorganization value and (2) a 40% weighting towards a comparable
company analysis based on financial ratios and multiples of comparable companies, which were then applied to our financial projections to arrive at a
reorganization value.
DCF Analysis. The DCF calculations were performed for the period beginning May 1, 2007 through December 31, 2010 ("Projection Period") discounted
to April 30, 2007, the date Delta emerged from bankruptcy. The cash flow estimates include projected changes associated with our reorganization initiatives,
anticipated changes in general market conditions and other factors. The DCF analysis includes assumptions for (1) the weighted average cost of capital, which
is used to calculate the present value of future cash flows and (2) the terminal EBITDAR multiple, used to determine the value after the Projection Period. A
range of discount rates from 12% to 14% was used, reflecting a number of company and market specific factors, as well as the cost of capital for comparable
companies. The terminal EBITDAR multiple of 5.50x — 6.25x is consistent with the ranges used in the comparable company analysis.
Variations in the valuation assumptions could significantly affect the cash flow estimates. The assumptions for which there is a reasonable possibility of
variation include, but are not limited to, assumptions regarding (1) revenues, (2) fuel costs, (3) achievement of cost reductions, (4) discount rates,
(5) international expansion and (6) the overall condition of the U.S. and global airline industries.
Comparable Company Analysis. The comparable company analysis identified a group of companies with similar lines of business, business risk, growth
prospects, maturity, market presence, size and scale of operations. Revenue and EBITDAR multiples were deemed to be the most relevant when analyzing the
peer group. A range of valuation multiples was then identified and applied to our projections to determine an estimate of reorganization values. The multiple
ranges used were 0.93x - 1.02x times 2007 estimated revenue of $18.5 billion and 5.50x - 6.25x times 2007 estimated EBITDAR of $2.9 billion.
All estimates, assumptions and financial projections, including the fair value adjustments, the financial projections and the reorganization value
projections, are subject to significant uncertainties and the resolution of contingencies beyond our control. Accordingly, there can be no assurance the
estimates, assumptions and financial projections will be realized, and actual results could vary materially.
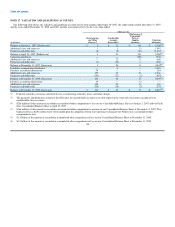
The adjustments set forth in the following Fresh Start Consolidated Balance Sheet in the columns captioned "Debt Discharge, Reclassifications and
Distribution to Creditors," "Repayment of Debtor-in-Possession ("DIP") Facility and New Exit Financing" and "Revaluation of Assets and Liabilities" reflect
the effect of the consummation of the transactions contemplated by Delta's Plan of Reorganization, including the settlement of various liabilities, securities
issuances, incurrence of new indebtedness and cash payments. 100