Delta Airlines 2009 Annual Report Download - page 55
Download and view the complete annual report
Please find page 55 of the 2009 Delta Airlines annual report below. You can navigate through the pages in the report by either clicking on the pages listed below, or by using the keyword search tool below to find specific information within the annual report.-
 1
1 -
2
-
3
-
4
-
5
-
6
-
7
-
8
-
9
-
10
-
11
-
12
-
13
-
14
-
15
-
16
-
17
-
18
-
19
-
20
-
21
-
22
-
23
-
24
-
25
-
26
-
27
-
28
-
29
-
30
-
31
-
32
-
33
-
34
-
35
-
36
-
37
-
38
-
39
-
40
-
41
-
42
-
43
-
44
-
 45
45 -
 46
46 -
 47
47 -
 48
48 -
 49
49 -
 50
50 -
 51
51 -
 52
52 -
 53
53 -
 54
54 -
 55
55 -
 56
56 -
 57
57 -
 58
58 -
 59
59 -
 60
60 -
 61
61 -
 62
62 -
 63
63 -
 64
64 -
 65
65 -
66
-
67
-
68
-
69
-
70
-
71
-
72
-
73
-
74
-
75
-
76
-
77
-
78
-
79
-
80
-
81
-
82
-
83
-
84
-
85
-
86
-
87
-
88
-
89
-
90
-
91
-
92
-
93
-
94
-
95
-
96
-
97
-
98
-
99
-
100
-
101
-
102
-
103
-
104
-
105
-
106
-
107
-
108
-
109
-
110
-
111
-
112
-
113
-
114
-
115
-
116
-
117
-
118
-
119
-
120
-
121
-
122
-
123
-
124
-
125
-
126
-
127
-
128
-
129
-
130
-
131
-
132
-
133
-
134
-
135
-
136
-
137
-
138
-
139
-
140
-
141
-
142
-
143
-
144
-
145
-
146
-
147
-
148
-
149
-
150
-
151
-
152
-
153
-
154
-
155
-
156
-
157
-
158
-
159
-
160
-
161
-
162
-
163
-
164
-
165
-
166
-
167
-
168
-
169
-
170
-
171
-
172
-
173
-
174
-
175
-
176
-
177
-
178
-
179
 |
 |
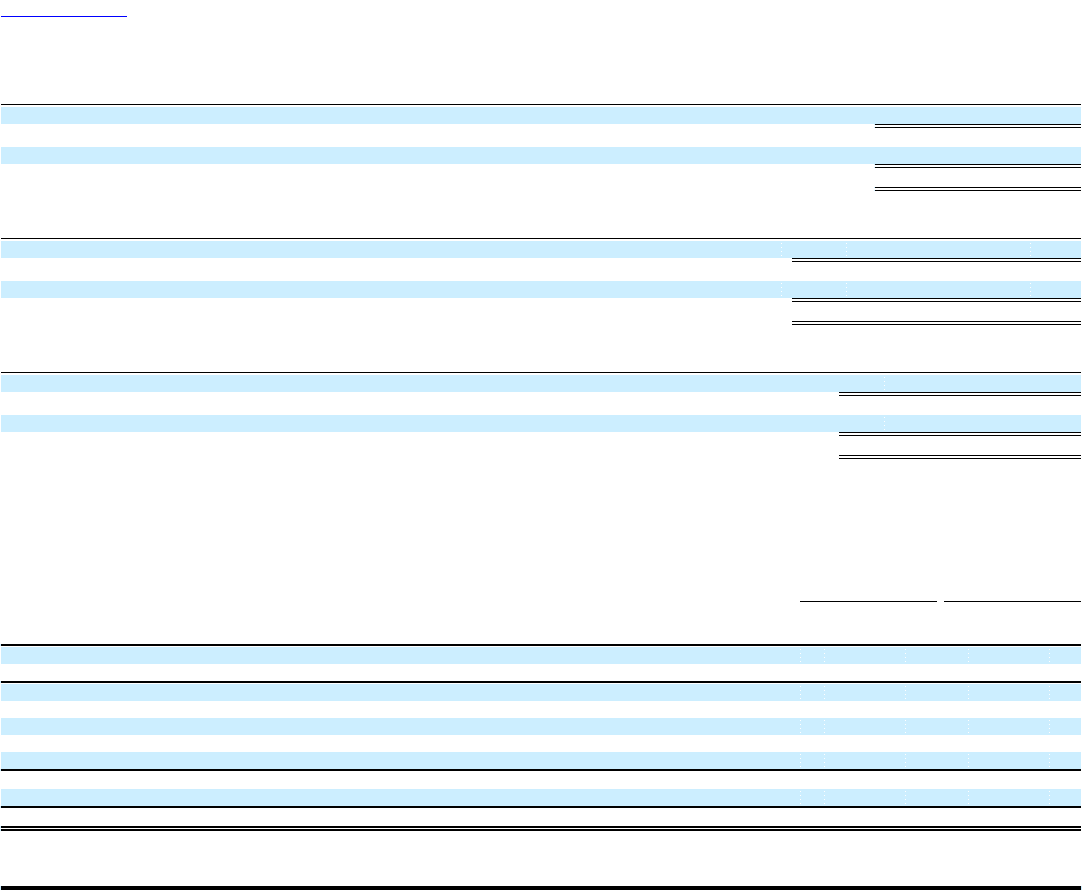
Table of Contents
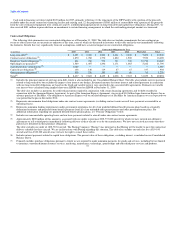
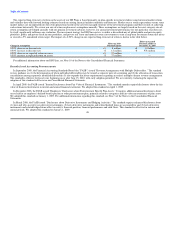
GAAP 2009 vs.
Combined 2008
2009 average price per fuel gallon, net of hedging activity $ 2.15
2008 combined fuel gallons consumed (in millions) 4,158
2008 combined average price per fuel gallon, net of hedging activity $ 3.29
Change year-over-year in fuel price per gallon, net of hedging activity (35)%
GAAP 2009 vs.
Combined 2008
2009 PRASM 10.34¢
2008 combined ASMs (in millions) 246,164
2008 combined PRASM 12.07¢
Change year-over-year in combined PRASM (14)%
GAAP 2009 vs.
Combined 2008
2009 passenger mile yield 12.60¢
2008 combined revenue passenger miles (in millions) 202,726
2008 combined passenger mile yield 14.65¢
Change year-over-year in combined passenger mile yield (14)%
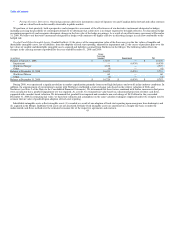
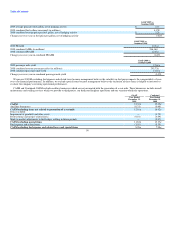
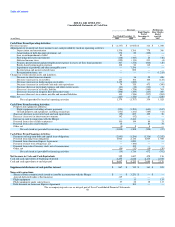
We present CASM excluding fuel expense and related taxes because management believes the volatility in fuel prices impacts the comparability of year-
over-year financial performance. In addition, we exclude special items because management believes the exclusion of these items is helpful to investors to
evaluate the company's recurring operational performance.
CASM and Combined CASM exclude ancillary businesses which are not associated with the generation of a seat mile. These businesses include aircraft
maintenance and staffing services which we provide to third parties, our dedicated freighter operations and our vacation wholesale operations.
GAAP Combined
Year Ended Year Ended
December 31, December 31,
2009 2008
CASM 12.32¢ 19.40¢
Ancillary businesses (0.31) (0.48)
CASM excluding items not related to generation of a seat mile 12.01¢ 18.92¢
Items excluded:
Impairment of goodwill and other assets — (4.79)
Restructuring and merger-related items (0.18) (0.59)
Mark-to-market adjustments to fuel hedges settling in future periods — (0.17)
CASM excluding special items 11.83¢ 13.37¢
Fuel expense and related taxes (3.55) (5.39)
CASM excluding fuel expense and related taxes and special items 8.28¢ 7.98¢
50